| Table of contents |

|
| Introduction |

|
| Potential Energy Curves: Understanding 1-D Surfaces |

|
| Analysis of Potential Energy Curves |

|
| Conclusions |

|
Introduction
A potential energy surface (PES) represents the potential energy of a collection of atoms, typically in terms of their spatial coordinates. The PES can describe energy as a function of one or more coordinates, with a potential energy curve or energy profile representing a PES with a single coordinate. The analogy of a landscape is often used, where energy values correspond to different bond lengths or other relevant variables. Each geometry of atoms in a chemical reaction corresponds to a unique potential energy, resulting in a smooth energy "landscape" that allows the study of chemistry from a topological perspective.
Potential Energy Curves: Understanding 1-D Surfaces
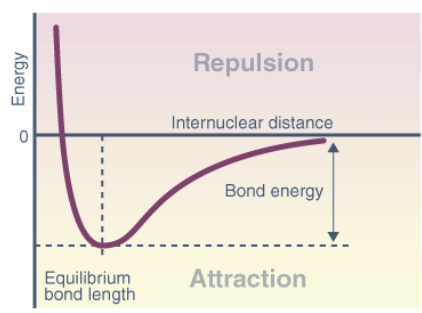
The potential energy curve (PEC) represents the energy of a molecule as a function of the positions of its nuclei, denoted by r. In a system with two atoms, the energy is proportional to their separation. At longer distances, no contact exists, resulting in zero energy. As the distance decreases, attractive forces dominate until the atoms reach the minimum point of the curve, where attractive and repulsive forces balance. This minimum point determines the bond length or equilibrium bond length, which reflects the average distance at which the atoms oscillate due to thermal motion. Shorter bonds typically indicate stronger bonding.
Analysis of Potential Energy Curves
Crystal Structure Packing and Bonding Energies: Different atoms arrange themselves in various crystalline formations based on their nature, leading to diverse potential energy curves. Random and dense ordered packing of atoms exhibit contrasting potential energy curves, highlighting the role of crystal structure in determining bonding energies.


- Mechanical Properties: Mechanical characteristics define how materials deform or break under stress, time, and temperature. Understanding potential energy curves helps elucidate the behavior of materials during deformation, elongation, compression, or fracture.
- Thermal Properties: Heat capacity, thermal expansion, and thermal conductivity describe a material's response to heat. Potential energy curves provide insights into how thermal energy is absorbed and transmitted through atom vibrations in solids.
- Electrical Properties: Electrical conductivity and resistivity characterize a material's ability to conduct electricity. The energy levels and electron availability in potential energy curves influence the electrical properties of solid materials.

Conclusions
The potential energy surface and curve are valuable conceptual tools for analyzing molecular geometry and chemical reaction kinetics. The characteristics of bonding energy and the shape of potential energy curves vary from one material to another. A deep and narrow trough in the curve indicates significant bond energy, high melting temperature, large elastic modulus, and a small coefficient of thermal expansion. The diameter and asymmetry of the potential energy curve reveal distinct material properties. Different materials exhibit varying potential energy curves based on their bonding types, such as metallic bond for metals and covalent and secondary bonding for polymers.

|
Explore Courses for JEE exam
|

|


