Practice Question - 15 (Venn Diagram) | 100 DILR Questions for CAT Preparation PDF Download

Students in a college are discussing two proposals -
A: a proposal by the authorities to introduce dress code on campus, and
B: a proposal by the students to allow multinational food franchises to set up outlets on college campus.
A student does not necessarily support either of the two proposals.
In an upcoming election for student union president, there are two candidates in fray:
Sunita and Ragini. Every student prefers one of the two candidates.
A survey was conducted among the students by picking a sample of 500 students. The following information was noted from this survey.
1. 250 students supported proposal A and 250 students supported proposal B.
2. Among the 200 students who preferred Sunita as student union president, 80% supported proposal A.
3. Among those who preferred Ragini, 30% supported proposal A.
4. 20% of those who supported proposal B preferred Sunita.
5. 40% of those who did not support proposal B preferred Ragini.
6. Every student who preferred Sunita and supported proposal B also supported proposal A.
7. Among those who preferred Ragini, 20% did not support any of the proposals.
Q1: Among the students surveyed who supported proposal A, what percentage preferred Sunita for student union president?
 View Answer
Ans: 64
Total number of students surveyed = 500
Every student prefers one of the two candidates. Ragini(R) and Sunita(S).
Thus, R+S=500.
According to statement 2, "Among the 200 students who preferred Sunita as student union president, 80% supported proposal A."
The number of students who support Sunita(S)=200
The number of students who supported Ragini(R)=300
According to statements 2 and 3, 160 students who supported Sunita also supported the proposal A & 90 students who supported Ragini also supported proposal A.
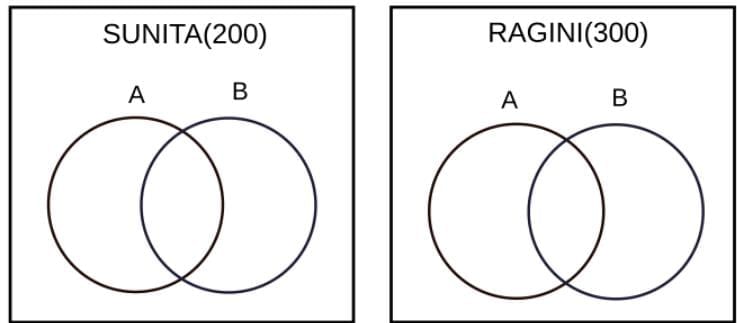
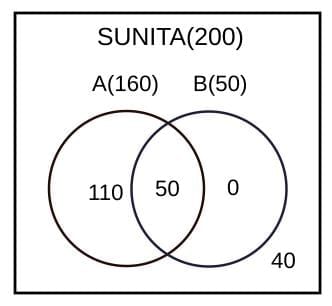
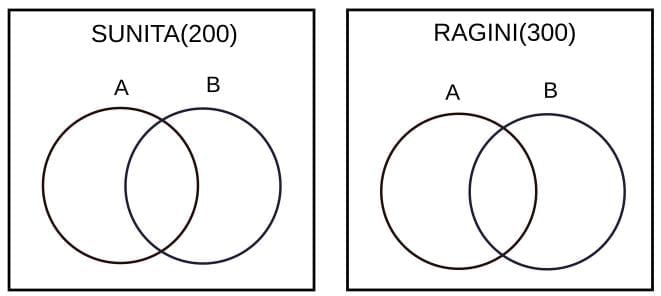
According to statements 4 and 6, we can make the following Venn diagram for Sunita.

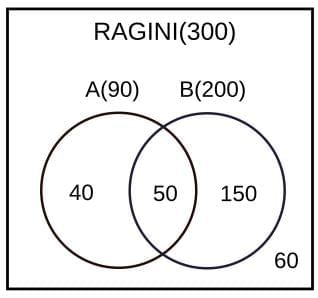
According to statement 5 and 7, we can make the following Venn diagram.

The number of students who preferred Sunita and the proposal A=160
=160/250= 64%
Q2: What percentage of the students surveyed who did not support proposal A preferred Ragini as student union president?
View Answer Ans: 84
Total number of students surveyed= 500
Every student prefers one of the two candidates. Ragini(R) and Sunita(S).
Thus, R+S=500.
According to statement 2, "Among the 200 students who preferred Sunita as student union president, 80% supported proposal A."
The number of students who support Sunita(S)=200
The number of students who supported Ragini(R)=300

According to statements 2 and 3, 160 students who supported Sunita also supported the proposal A & 90 students who supported Ragini also supported proposal A.
According to statements 4 and 6, we can make the following Venn diagram for Sunita.
According to statement 5 and 7, we can make the following Venn diagram.

The percentage of the students surveyed who did not support proposal A preferred Ragini as student union president = 210/250 = 84%
Answer 84
Q3: What percentage of the students surveyed who supported both proposals A and B preferred Sunita as student union president?
(a) 40
(b) 25
(c) 20
(d) 50
View Answer Ans: (d)
Total number of students surveyed= 500
Every student prefers one of the two candidates. Ragini(R) and Sunita(S).
Thus, R + S = 500.
According to statement 2, "Among the 200 students who preferred Sunita as student union president, 80% supported proposal A."
The number of students who support Sunita(S)=200
The number of students who supported Ragini(R)=300
According to statements 2 and 3, 160 students who supported Sunita also supported the proposal A & 90 students who supported Ragini also supported proposal A.
According to statements 4 and 6, we can make the following Venn diagram for Sunita.

According to statement 5 and 7, we can make the following Venn diagram.
According to the Venn diagram, the students surveyed who supported both proposals A and B preferred Sunita as student union president 
Q4: How many of the students surveyed supported proposal B, did not support proposal A and preferred Ragini as student union president?
(a) 150
(b) 210
(c) 200
(d) 40
View Answer Ans: (a)
Total number of students surveyed= 500
Every student prefers one of the two candidates. Ragini(R) and Sunita(S).
Thus, R + S = 500.
According to statement 2, "Among the 200 students who preferred Sunita as student union president, 80% supported proposal A."
The number of students who support Sunita(S)=200
The number of students who supported Ragini(R)=300

According to statements 2 and 3, 160 students who supported Sunita also supported the proposal A & 90 students who supported Ragini also supported proposal A.
According to statements 4 and 6, we can make the following Venn diagram for Sunita.

According to statement 5 and 7, we can make the following Venn diagram.

From the diagram, we can understand that option (a) is correct.
|
102 videos|123 docs|121 tests
|
FAQs on Practice Question - 15 (Venn Diagram) - 100 DILR Questions for CAT Preparation
| 1. What is a Venn diagram and how is it used in problem-solving? |  |
| 2. What types of questions can be solved using Venn diagrams in exams? | |
| 3. How can I effectively interpret Venn diagrams during exams? | |
| 4. What are some common mistakes to avoid when using Venn diagrams? | |
| 5. Can Venn diagrams be applied to real-life situations outside of exams? | |


Objective type Questions
,shortcuts and tricks
,practice quizzes
,Viva Questions
,Practice Question - 15 (Venn Diagram) | 100 DILR Questions for CAT Preparation
,Practice Question - 15 (Venn Diagram) | 100 DILR Questions for CAT Preparation
,study material
,Important questions
,MCQs
,ppt
,video lectures
,mock tests for examination
,Sample Paper
,Extra Questions
,Exam
,Summary
,Previous Year Questions with Solutions
,Semester Notes
,Practice Question - 15 (Venn Diagram) | 100 DILR Questions for CAT Preparation
,past year papers
,Free
;


Practice Question - 15 (Venn Diagram) Free PDF Download
Importance of Practice Question - 15 (Venn Diagram)
Practice Question - 15 (Venn Diagram) Notes
Practice Question - 15 (Venn Diagram) CAT Questions
Study Practice Question - 15 (Venn Diagram) on the App
|
© EduRev
|
Education Revolution
|


|


within 7 days!