CAT Exam  >  CAT Notes  >  Practice Questions Level 2: Bar Graph

Bar Graph Questions for CAT with Answers PDF

This EduRev document offers 20 Multiple Choice Questions (MCQs) from the topic Bar Graphy (Level - 2). These questions are of Level - 2 difficulty and will assist you in the preparation of CAT & other MBA exams. You can practice/attempt these CAT Multiple Choice Questions (MCQs) and check the explanations for a better understanding of the topic. 
Question for Practice Questions Level 2: Bar Graph
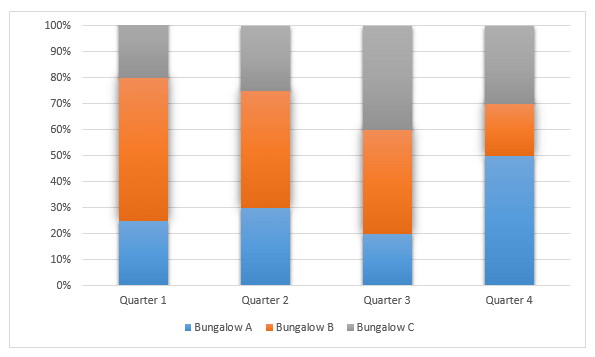
Try yourself:Directions: A housing society comprises 3 bungalows - A, B and C. The % solid waste generated by 3 bungalows over 4 quarters of 2018 is represented in the graph below. It is known that bungalow C generated 120 kg of waste in the 1st quarter, bungalow A generated 210 kg of waste in the 2nd quarter, bungalow B generated 250 kg of waste in the 3rd quarter, and bungalow A generated 325 kg of waste in the 4th quarter.
Bar Graph Questions for CAT with Answers PDF

Q. Which of the following statements is/are true?

1. There is a gradual increase in the total solid waste generated by bungalow C in the 4 quarters.
2. There is a gradual decrease in the total solid waste generated by bungalow B in the 4 quarters.
3. Bungalow A generated the lowest quantity of waste in 2018.
4. Bungalow C generated the lowest quantity of waste in each quarter of 2018.
View Solution

Question for Practice Questions Level 2: Bar Graph
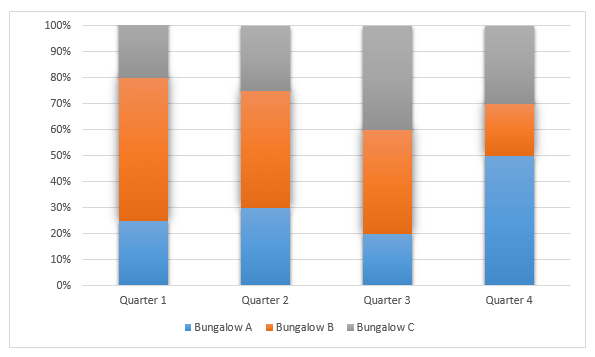
Try yourself:Directions: A housing society comprises 3 bungalows - A, B and C. The % solid waste generated by 3 bungalows over 4 quarters of 2018 is represented in the graph below. It is known that bungalow C generated 120 kg of waste in the 1st quarter, bungalow A generated 210 kg of waste in the 2nd quarter, bungalow B generated 250 kg of waste in the 3rd quarter, and bungalow A generated 325 kg of waste in the 4th quarter.
Bar Graph Questions for CAT with Answers PDF

Q. What is the average waste generated by bungalow A per month in 2018?
View Solution

Question for Practice Questions Level 2: Bar Graph
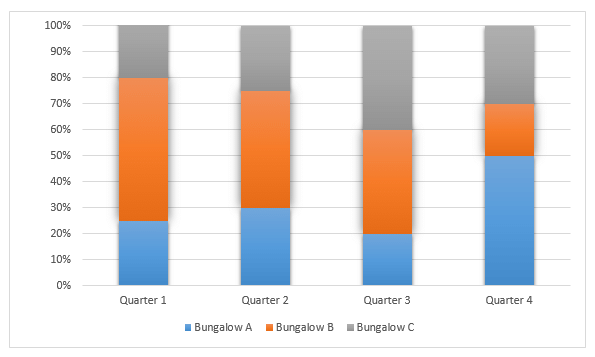
Try yourself:Directions: A housing society comprises 3 bungalows - A, B and C. The % solid waste generated by 3 bungalows over 4 quarters of 2018 is represented in the graph below. It is known that bungalow C generated 120 kg of waste in the 1st quarter, bungalow A generated 210 kg of waste in the 2nd quarter, bungalow B generated 250 kg of waste in the 3rd quarter, and bungalow A generated 325 kg of waste in the 4th quarter.

Bar Graph Questions for CAT with Answers PDF

Q. In which quarter is the total solid waste generated by all the 3 bungalows the lowest?
View Solution

Question for Practice Questions Level 2: Bar Graph
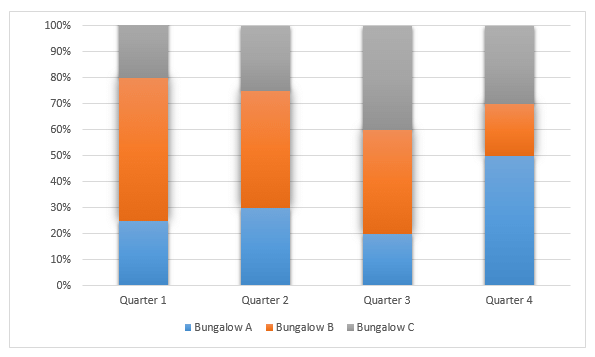
Try yourself:Directions: A housing society comprises 3 bungalows - A, B and C. The % solid waste generated by 3 bungalows over 4 quarters of 2018 is represented in the graph below. It is known that bungalow C generated 120 kg of waste in the 1st quarter, bungalow A generated 210 kg of waste in the 2nd quarter, bungalow B generated 250 kg of waste in the 3rd quarter, and bungalow A generated 325 kg of waste in the 4th quarter.

Bar Graph Questions for CAT with Answers PDF

Q. In which quarter is the highest quantity of solid waste generated?
View Solution

Question for Practice Questions Level 2: Bar Graph
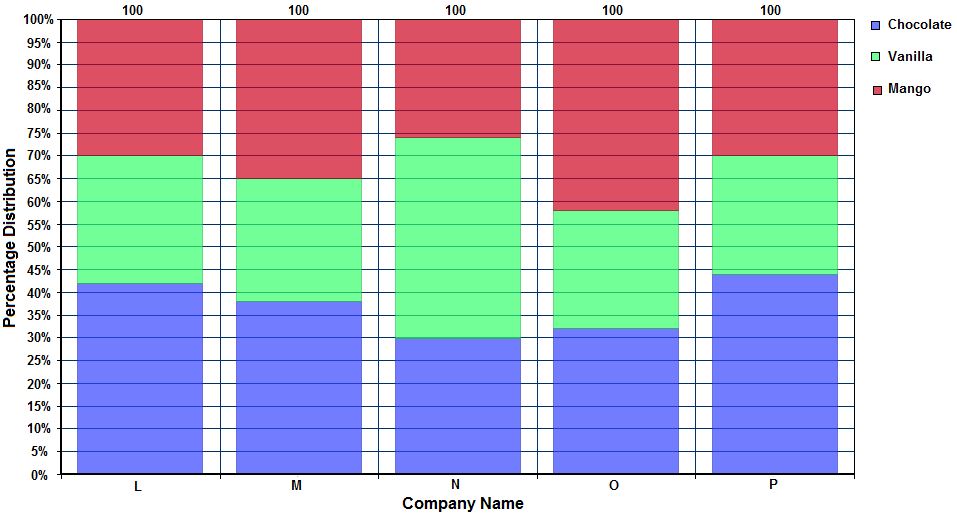
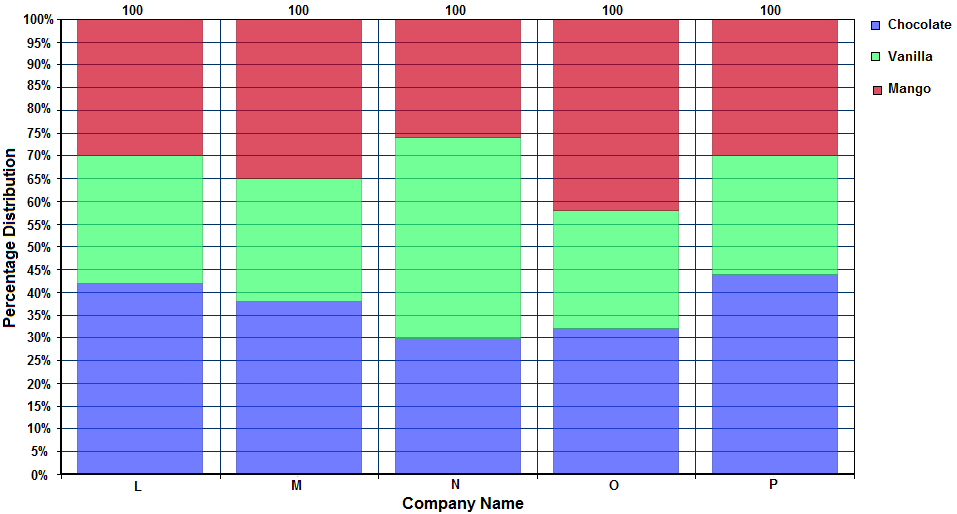
Try yourself:Diections: The following bar chart shows the percentage distribution of total production of three different flavoured ice creams by five different companies (L, M, N, O and P) during the year 2015.
Bar Graph Questions for CAT with Answers PDF

Q. If the total production of ice creams by company O is 150000 and that of company L is 120000, then the production of vanilla ice cream by company O is what percent of production of chocolate ice cream by company L?
View Solution

Question for Practice Questions Level 2: Bar Graph
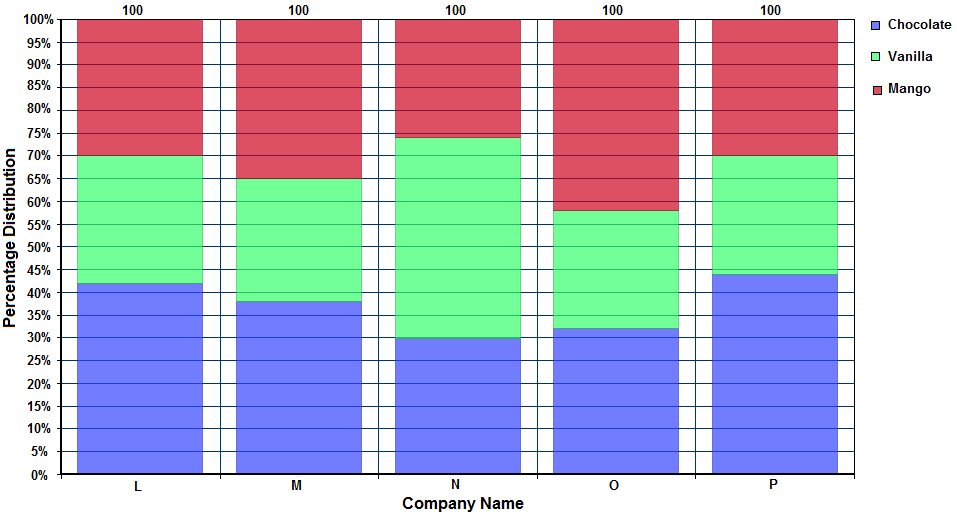
Try yourself:Directions: The following bar chart shows the percentage distribution of total production of three different flavoured ice creams by five different companies (L, M, N, O and P) during the year 2015.
Bar Graph Questions for CAT with Answers PDF

If the total production of chocolate flavoured ice cream by company N is 36000, then what is the difference between the total production of vanilla ice cream and mango ice cream by the same company?
View Solution

Question for Practice Questions Level 2: Bar Graph
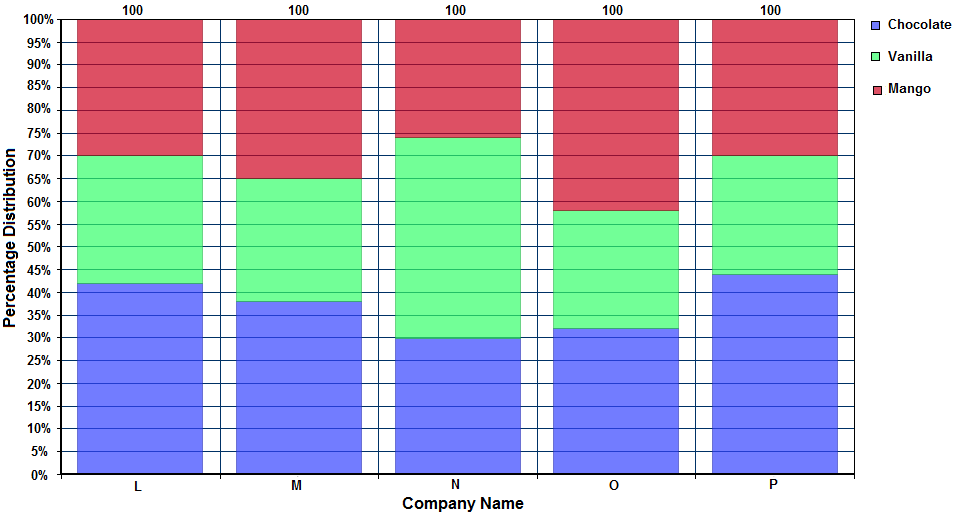
Try yourself:Directions: The following bar chart shows the percentage distribution of total production of three different flavoured ice creams by five different companies (L, M, N, O and P) during the year 2015.
Bar Graph Questions for CAT with Answers PDF

Q. If the total production of mango ice cream by company N is 58240 and the total production of vanilla ice cream by company L is 20% more than that of production of mango ice cream by company N, then what is the sum of the total production of ice cream by company N and L? 
View Solution

Question for Practice Questions Level 2: Bar Graph
Try yourself:Directions: The following bar chart shows the percentage distribution of total production of three different flavoured ice creams by five different companies (L, M, N, O and P) during the year 2015.
Bar Graph Questions for CAT with Answers PDF

Q. If the production of chocolate ice cream by company P is 35200 and the total production of ice cream by company M isof the total production of ice cream by company P, then what is the total production of vanilla ice cream by company M?
View Solution

Question for Practice Questions Level 2: Bar Graph
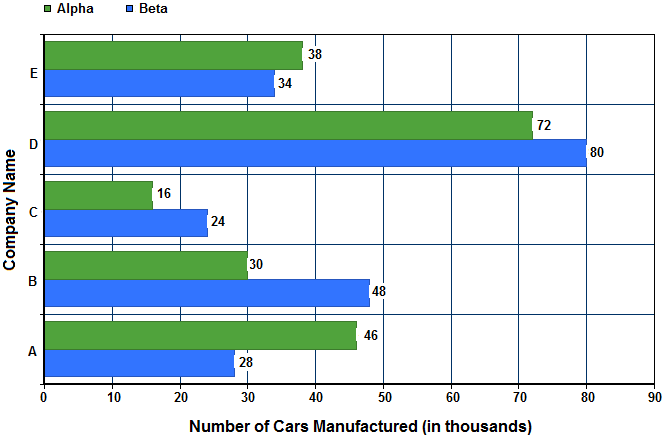
Try yourself:Directions: The bar chart shows the total manufacture of two different types of cars (Alpha and Beta) by five companies from the year 2011 - 2015.
Bar Graph Questions for CAT with Answers PDF

Q. The average of total number of Beta cars manufactured by company A and Alpha cars by company D is what percentage of the total number of Alpha cars manufactured by company C and E?

View Solution

Question for Practice Questions Level 2: Bar Graph
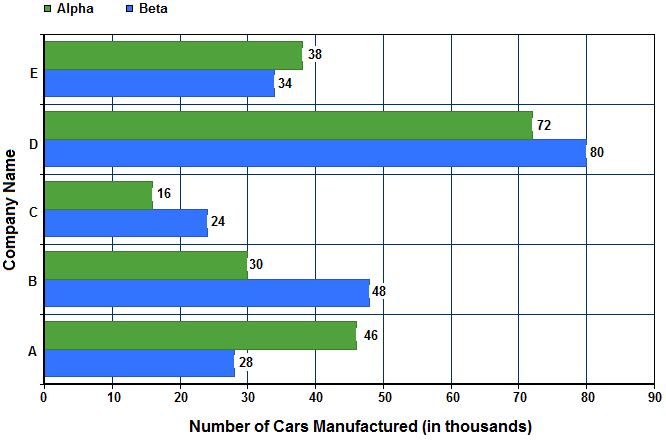
Try yourself:Directions: The bar chart shows the total manufacture of two different types of cars (Alpha and Beta) by five companies from the year 2011 - 2015.
Bar Graph Questions for CAT with Answers PDF

Q. What will be the ratio of the difference between number of Beta cars manufactured by company D and B to the total number of Alpha cars manufactured by company A and C?
View Solution

Question for Practice Questions Level 2: Bar Graph
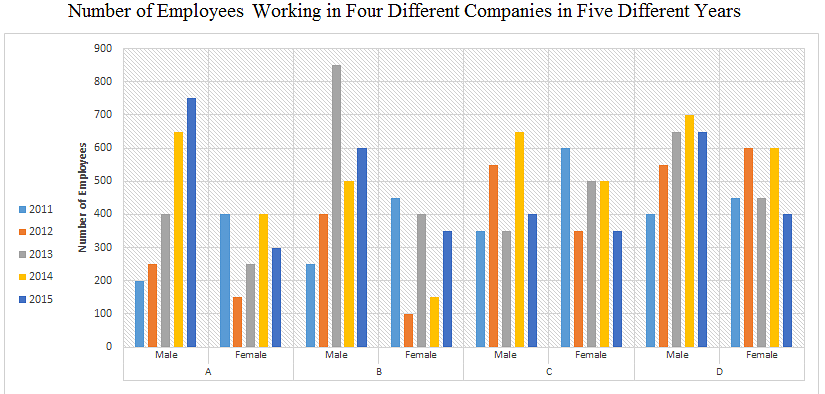
Try yourself:Directions: The bar chart shows the total manufacture of two different types of cars (Alpha and Beta) by five companies from the year 2011 - 2015.
Bar Graph Questions for CAT with Answers PDF

Q. If the total number of cars manufactured (both Alpha and Beta) by company A during 2011 and 2012 is 20,000 and the ratio of the number of Alpha cars manufactured to that of Beta cars is 13 : 7, then what is the percentage increase in the number of Alpha cars manufactured by company C during 2011 - 2015 to the numbers of Beta cars manufactured by company A during 2011 - 2012?
View Solution

Question for Practice Questions Level 2: Bar Graph
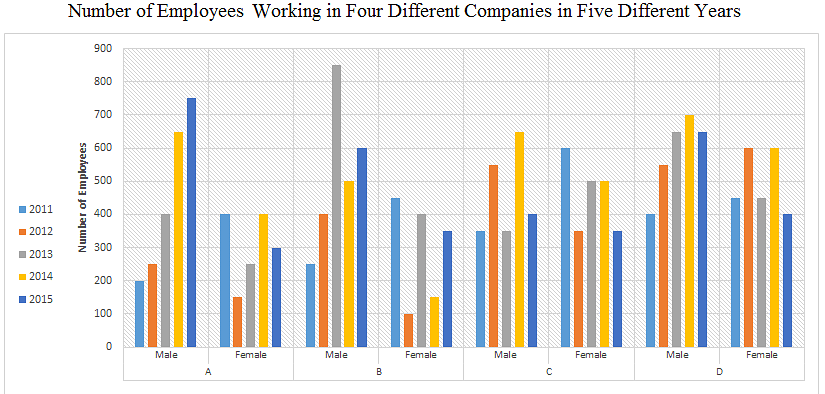
Try yourself:Directions: Study the following graph carefully and answer the question given below.
Bar Graph Questions for CAT with Answers PDF

Q. If 40% of males and 30% of females in company D in the year 2012 were handicapped, then what was the total number of handicapped candidates in that company in that year?
View Solution

Question for Practice Questions Level 2: Bar Graph
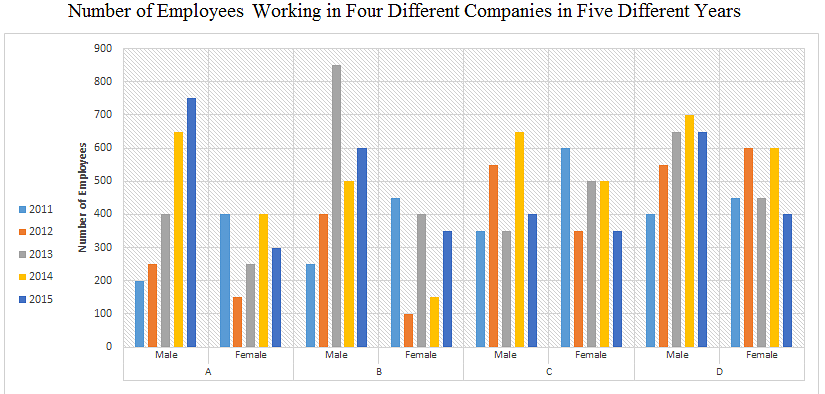
Try yourself:Directions: Study the following graph carefully and answer the question given below.
Bar Graph Questions for CAT with Answers PDF

Q. If there is a 20% increase in male employees in company B in 2016 as compared to 2015 and a 30% increase in female employees as well, then what will be the total number of employees in company B in 2016?
View Solution

Question for Practice Questions Level 2: Bar Graph
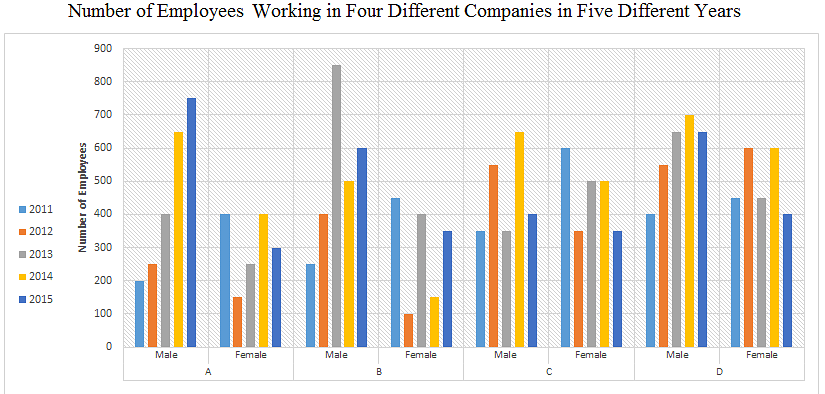
Try yourself:Directions: Study the following graph carefully and answer the question given below.
Bar Graph Questions for CAT with Answers PDF

Q. What was the average number of female employees for company B from 2011 to 2015?
View Solution

Question for Practice Questions Level 2: Bar Graph
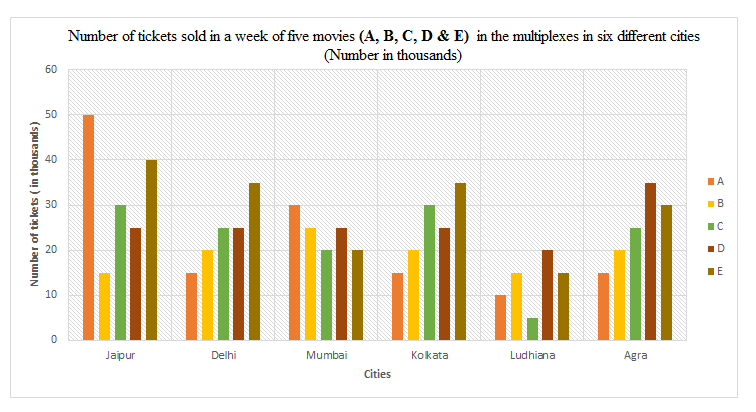
Try yourself:Directions: Study the following graph carefully and answer the question given below.
Bar Graph Questions for CAT with Answers PDF

Q. What was the total number of males working in company A in 2014, males working in the company B in 2011, females working in company D in 2013 and females working in the company A in 2012?
View Solution

Question for Practice Questions Level 2: Bar Graph
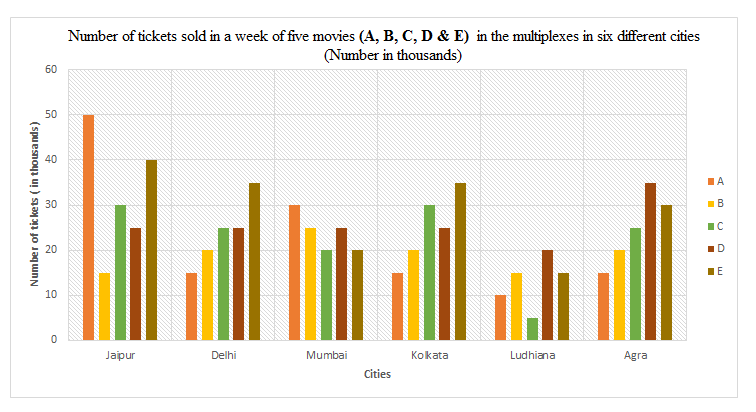
Try yourself:Directions: Study the following chart carefully and answer the question given below.Bar Graph Questions for CAT with Answers PDF

Q. What is the difference between the number of tickets of movie A sold in Jaipur and the number of tickets of movie C sold in Ludhiana?
View Solution

Question for Practice Questions Level 2: Bar Graph
Try yourself:Directions: Study the following chart carefully and answer the question given below:Bar Graph Questions for CAT with Answers PDF

Q. The number of tickets of movie B sold in Delhi is what percentage of the number of tickets of movie E sold in Jaipur?
View Solution

Question for Practice Questions Level 2: Bar Graph
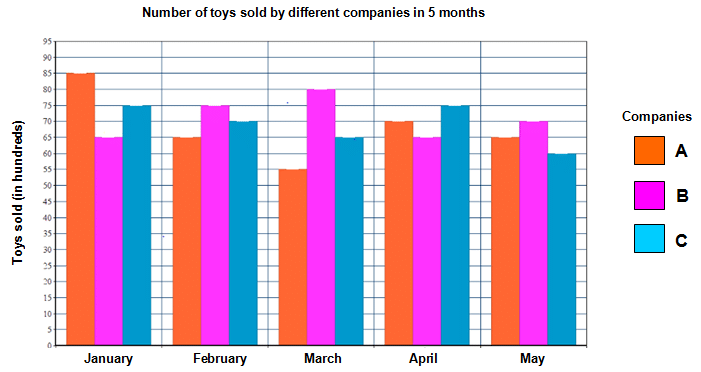
Try yourself:Directions: Study the following bar graph carefully and answer the question that follows.
Bar Graph Questions for CAT with Answers PDF

Q. If the total number of toys sold by company A in 5 months is 32.69% of the total number of toys sold by all three companies in 5 months, then find the percentage of total number of toys sold by company C in 5 months.
View Solution

Question for Practice Questions Level 2: Bar Graph
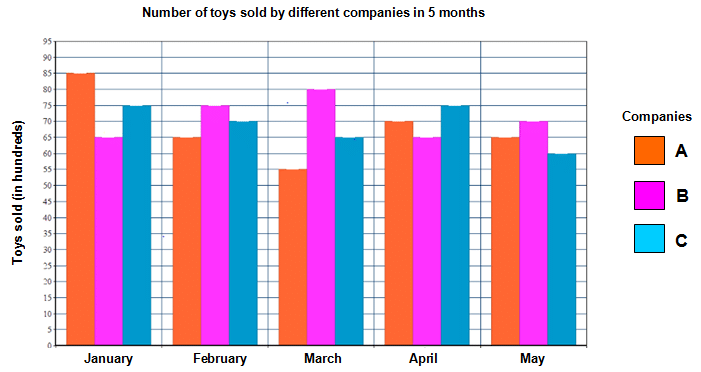
Try yourself:Directions: Study the following bar graph carefully and answer the question that follows.
Bar Graph Questions for CAT with Answers PDF

Q. If the percentage increase in the sales of company C in April from March is 15.38%, then find the percentage decrease in the sales of the same company in May from April.

View Solution

Question for Practice Questions Level 2: Bar Graph
Try yourself:Directions: Study the following bar graph carefully and answer the question that follows.
Bar Graph Questions for CAT with Answers PDF

Q. If the average number of toys sold by company C was 69, then find the ratio of average number of toys sold by company A to average number of toys sold by company B.

View Solution

The document Bar Graph Questions for CAT with Answers PDF is a part of CAT category.
All you need of CAT at this link: CAT

Top Courses for CAT

Download as PDF
Explore Courses for CAT exam

Top Courses for CAT

Signup for Free!
Signup to see your scores go up within 7 days! Learn & Practice with 1000+ FREE Notes, Videos & Tests.
10M+ students study on EduRev
Related Searches

pdf

,

Extra Questions

,

Summary

,

Objective type Questions

,

Bar Graph Questions for CAT with Answers PDF

,

practice quizzes

,

MCQs

,

Free

,

mock tests for examination

,

video lectures

,

past year papers

,

Bar Graph Questions for CAT with Answers PDF

,

Semester Notes

,

shortcuts and tricks

,

study material

,

Previous Year Questions with Solutions

,

Viva Questions

,

Bar Graph Questions for CAT with Answers PDF

,

ppt

,

Sample Paper

,

Important questions

,

Exam

;