This EduRev document offers 10 Multiple Choice Questions (MCQs) from the topic line Graph (Level - 2). These questions are of Level - 2 difficulty and will assist you in the preparation of CAT & other MBA exams. You can practice/attempt these CAT Multiple Choice Questions (MCQs) and check the explanations for a better understanding of the topic.
Question for Practice Questions Level 2: Line Graph
Try yourself:Directions: Answer the given question based on the following line graph:
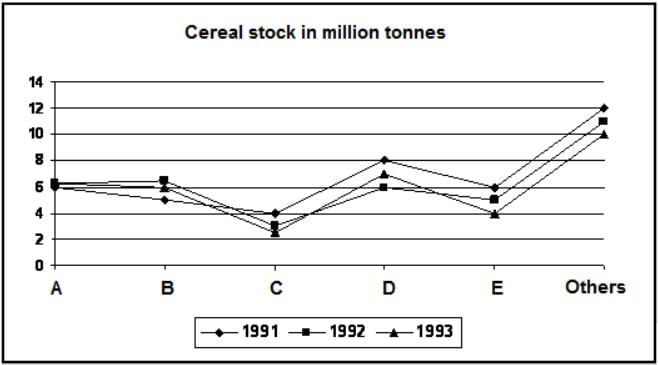
Calculate the increase in stock of cereal 1 for 1992
Explanation
Within a year, increase/decrease in stock for any cereal cannot be determined from the given data.
Report a problem
Question for Practice Questions Level 2: Line Graph
Try yourself:Directions: Study the given information carefully and answer the following question.
The graph below represents sales and net profit in Rs. crore of IVP Ltd. for five years from 1994-95 to 1998-99. During this period, the sales increased from Rs. 100 crore to Rs. 680 crore. Correspondingly, the net profit increased from Rs. 2.5 crore to Rs. 12 crore. Net profit is defined as the excess of sales over total costs.
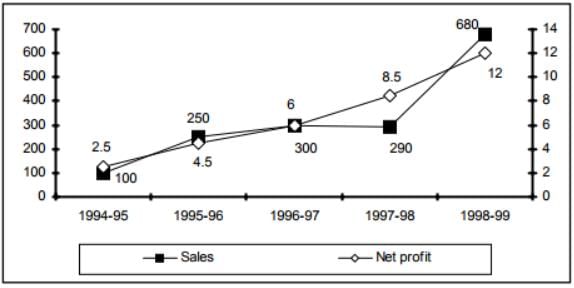
Q. Defining profitability as the ratio of net profit to net sales, it can be concluded that
Explanation
It can be seen that profitability did not follow a fixed pattern as the first three statements try to generalise it. Therefore, they are not applicable.
Report a problem
Question for Practice Questions Level 2: Line Graph
Try yourself:Directions: Study the given information carefully and answer the following question.
The graph below represents sales and net profit in Rs. crore of IVP Ltd. for five years from 1994-95 to 1998-99. During this period, the sales increased from Rs. 100 crore to Rs. 680 crore. Correspondingly, the net profit increased from Rs. 2.5 crore to Rs. 12 crore. Net profit is defined as the excess of sales over total costs.
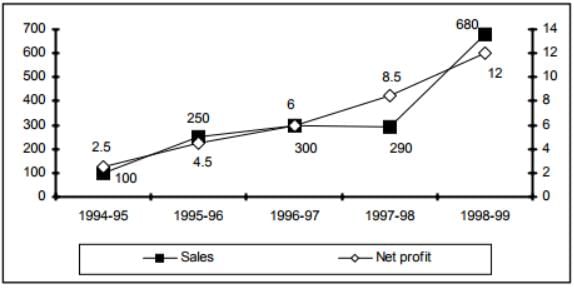
Q. The highest percentage growth in net profit as compared to the previous year was seen in
Explanation
From the graph, we can calculate the growth in profits.
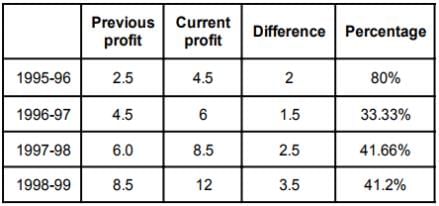
The highest percentage growth in net profit as compared to the previous year was seen in 1995-96.
Report a problem
Question for Practice Questions Level 2: Line Graph
Try yourself:Directions: Study the given information carefully and answer the following question.
The graph below represents sales and net profit in Rs. crore of IVP Ltd. for five years from 1994-95 to 1998-99. During this period, the sales increased from Rs. 100 crore to Rs. 680 crore. Correspondingly, the net profit increased from Rs. 2.5 crore to Rs. 12 crore. Net profit is defined as the excess of sales over total costs.
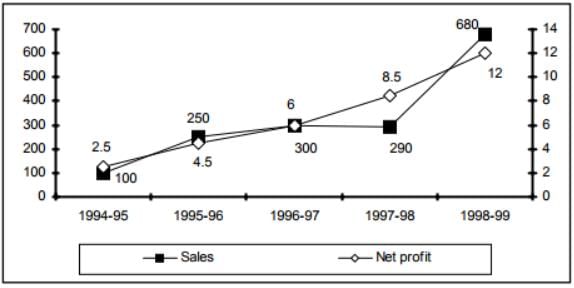
Q. The highest percentage of growth in sales over the previous year occurred in
Explanation
From the graph, we know that the percentage growth in sales were:
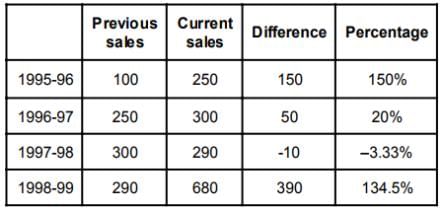
It is but obvious from the above table that the maximum percentage increase in sales as compared to the previous year occurred in 1995-96.
Report a problem
Question for Practice Questions Level 2: Line Graph
Try yourself:Directions: Study the following graph carefully and answer the question given below.
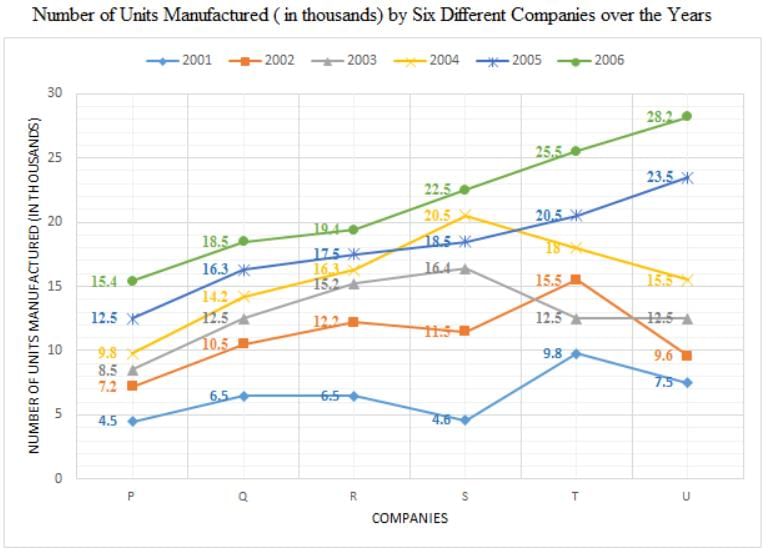
Q. The total number of units manufactured by companies R, S and U in the year 2006 is what percentage of the total number of units manufactured by Company P in all the years together?
Explanation
The total number of units manufactured by companies R, S and U in the year 2006 = 19.4 + 22.5 + 28.2 = 70.1 thousands
The total number of units manufactured by Company P in all the years together = 4.5 + 7.2 + 8.5 + 9.8 + 12.5 + 15.4 = 57.9 thousands
Required percentage = 70.1/57.9 x 100
= 121.07
≈ 121
Report a problem
Question for Practice Questions Level 2: Line Graph
Try yourself:Directions: Study the following graph carefully and answer the question given below.

Q. What is the average number of units sold by Company S in the years 2001, 2002, 2003, 2004 and 2005?
Explanation
The total number of units sold by Company S in the years 2001, 2002, 2003, 2004 and 2005 = 4.6 + 11.5 + 16.4 + 18.5 + 20.5 = 71.5 thousands = 71,500 units
Required average = 71,500/5 = 14,300
Report a problem
Question for Practice Questions Level 2: Line Graph
Try yourself:Directions: Study the following graph carefully and answer the question given below.

Q. What is the respective ratio of total number of units manufactured by companies Q and R together in the year 2001 to those manufactured by companies S and T together in the year 2003?
Explanation
The total number of units manufactured by companies Q and R together in the year 2001 = 6.5 + 6.5 = 13 thousands
The total number of units manufactured by companies S and T together in the year 2003 = 16.4 + 12.5 = 28.9 thousands
Required ratio = 13 : 28.9
= 130 : 289
Report a problem
Question for Practice Questions Level 2: Line Graph
Try yourself:Directions: Study the following graph carefully and answer the question given below.
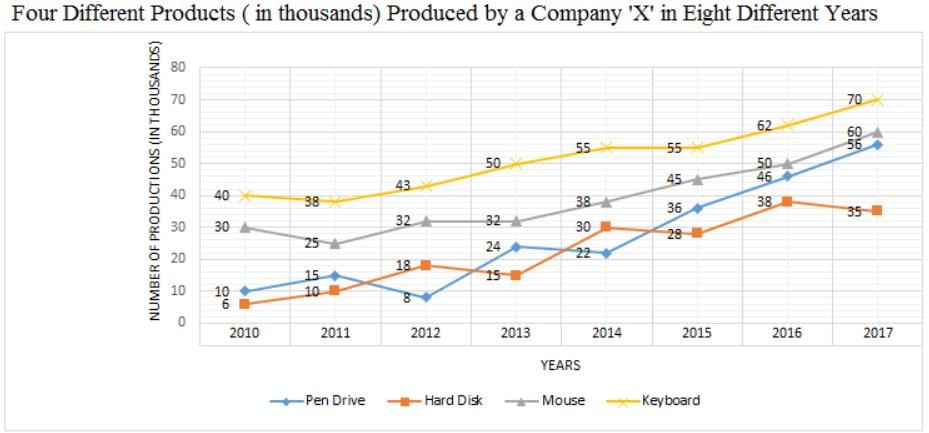
Q. What is the average number of hard disks produced by Company 'X' over all the years together?
Explanation
Total number of hard disks produced by Company 'X' over all the years together = 6 + 10 + 18 + 15 + 30 + 28 + 38 + 35 = 180 (in thousand) = 1,80,000
Required average = 1, 80, 000/8 = 22,500
Report a problem
Question for Practice Questions Level 2: Line Graph
Try yourself:Directions: Study the following graph carefully and answer the question given below.
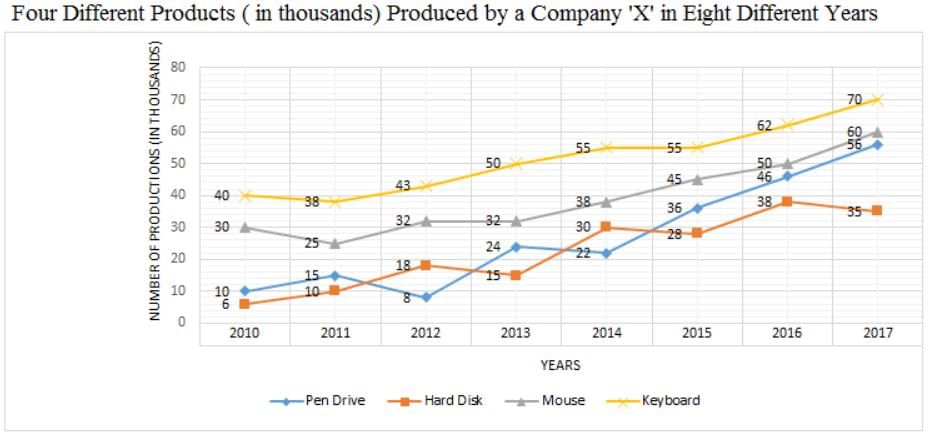
Q. What is the difference between the total number of hard disks and mouses produced by Company 'X' in the year 2010 and the total number of keyboards and pen drives produced by Company 'X' in the year 2015?
Explanation
Total number of hard disks and mouses produced by Company 'X' in the year 2010 = 6 + 30 = 36 thousand = 36,000
Number of keyboards and pen drives produced by Company 'X' in the year 2015 = 55 + 36 = 91 thousand = 91,000
Required difference = 91,000 - 36,000 = 55,000
Report a problem
Question for Practice Questions Level 2: Line Graph
Try yourself:Directions: Study the following graph carefully and answer the question given below.
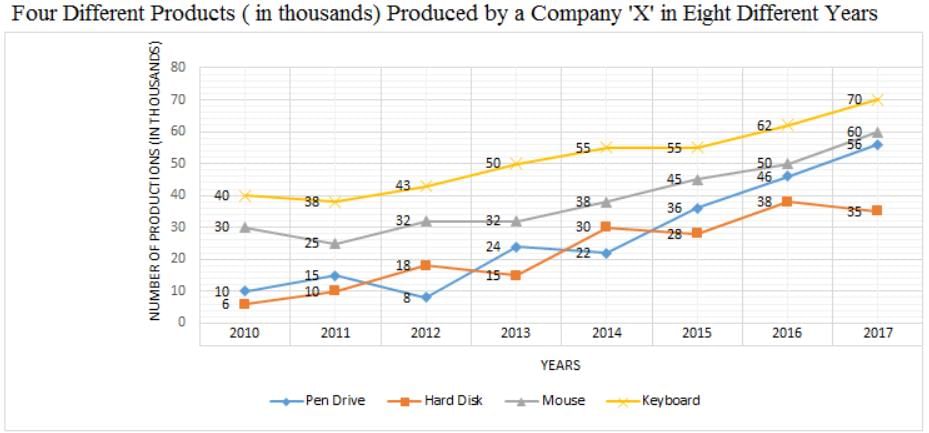
Q. What was the respective ratio between the number of pen drives produced by Company 'X' in the years 2010, 2011, 2014 and 2015 and the number of hard disks produced by Company 'X' in the years 2011, 2012, 2015 and 2017?
Explanation
The number of pen drives produced by Company 'X' in years 2010, 2011, 2014 and 2015 = 10 + 15 + 22 + 36 = 83 (in thousands)
The number of hard disks produced by Company 'X' in years 2011, 2012, 2015 and 2017 = 10 + 18 + 28 + 35 = 91 (in thousands)
Required ratio = 83 : 91
Report a problem


