Price elasticity of demand | Economics for Grade 12 PDF Download
The Definition & Calculation of PED
- The law of demand states that when there is an increase in price, there will be a fall in quantity demanded
- Economists are interested by how much the quantity demanded will fall
- Price elasticity of demand reveals how responsive the change in quantity demanded is to a change in price
- The responsiveness is different for different types of products
Calculation of PED
- PED can be calculated using the following formula

- To calculate a % change, use the following formula

Example: A firm raises the price of its products from £10 to £15. Its sales fall from 100 to 40 units per day. Calculate the PED of its products
Step 1: Calculate the % change in QD
Step 2: Calculate the % change in P
Step 3: Insert the above values in the PED formula
PED = -60/50
PED = -1.2
The PED value will always be negative so economists ignore the sign and present the answer as 1.2
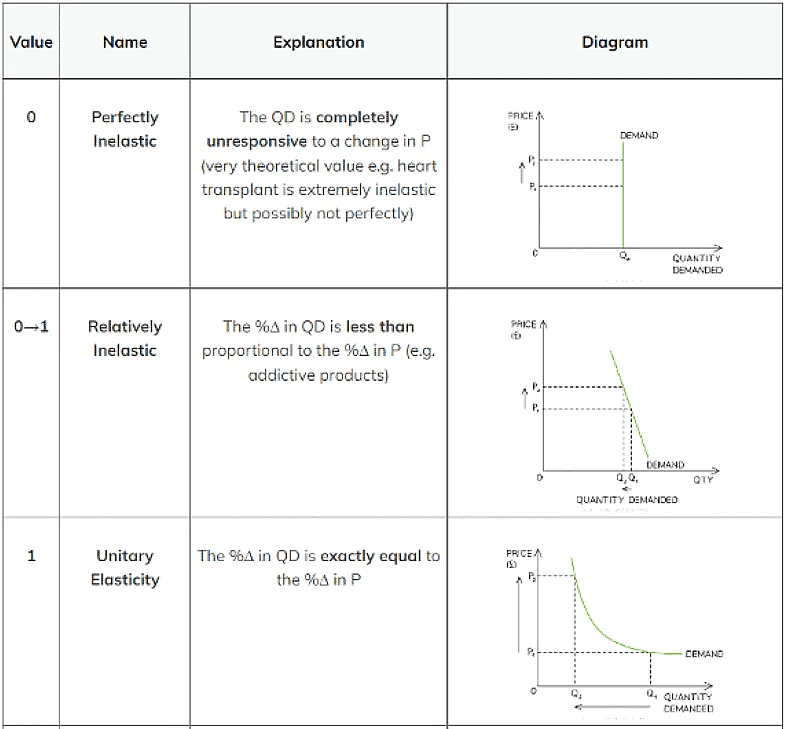
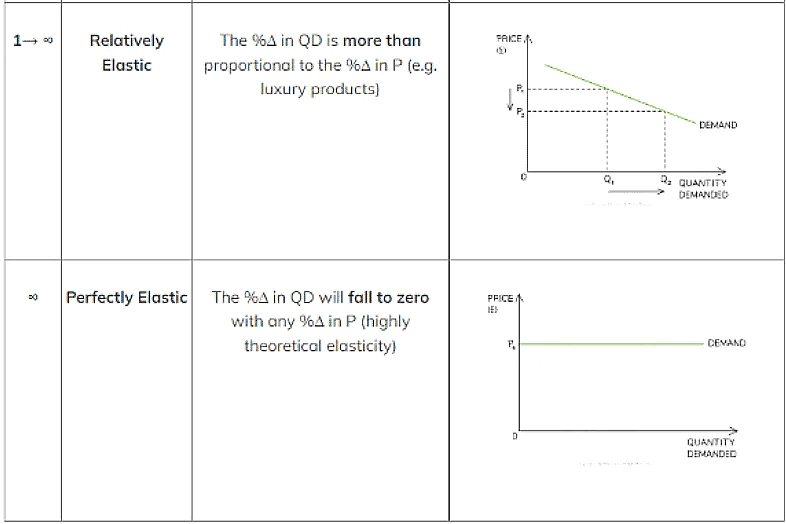
Interpreting PED Values
The Size of PED Varies From 0 To Infinity (∞) & Is Classified As Follows

The Determinants of PED
- Some products are more responsive to changes in prices than other products
- The factors that determine the responsiveness are called the determinants of PED & include:
- Availability of substitutes: good availability of substitutes results in a higher value of PED (relatively elastic)
- Addictiveness of the product: addictiveness turns products into necessities resulting in a low value of PED (relatively inelastic)
- Price of product as a proportion of income: the lower the proportion of income the price represents, the lower the PED value will be. Consumers are less responsive to price changes on cheap products (relatively inelastic)
- Time period: In the short term, consumers are less responsive to price increases resulting in a low value of PED (relatively inelastic). Over a longer time period consumers may feel the price increase more and will then look for substitutes resulting in a higher value of PED (relatively elastic)
PED & Total Revenue
- Revenue is the amount of money a firm receives from selling its goods/services
- Total revenue = price x quantity
- The total revenue rule states that in order to maximise revenue, firms should increase the price of products that are inelastic in demand & decrease prices on products that are elastic in demand
- This can be illustrated using a demand curve

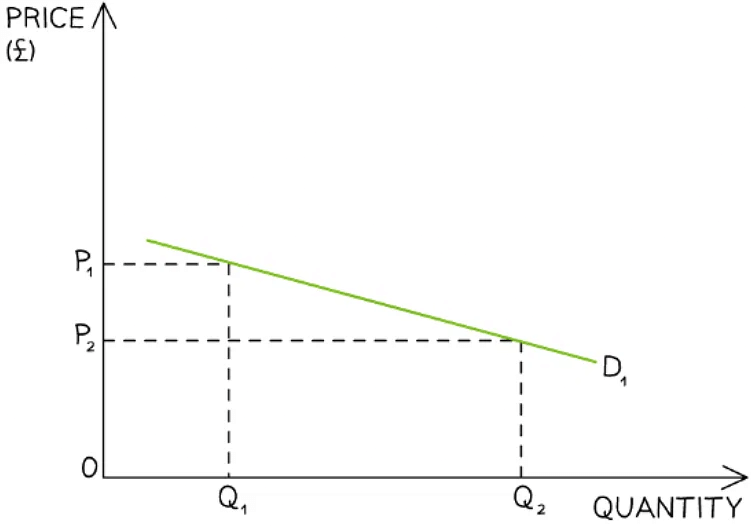
An illustration of price elastic demand where a small decrease in price from P1→P2 causes a large increase in quantity demanded from Q1→ Q2
Diagram Analysis
- The demand curve is very elastic in this market
- When a good/service is price elastic in demand, there is a greater than proportional increase in the quantity demanded to a decrease in price
- Total revenue is higher once the price has been decreased
(P2 X Q2) > (P1 X Q1)
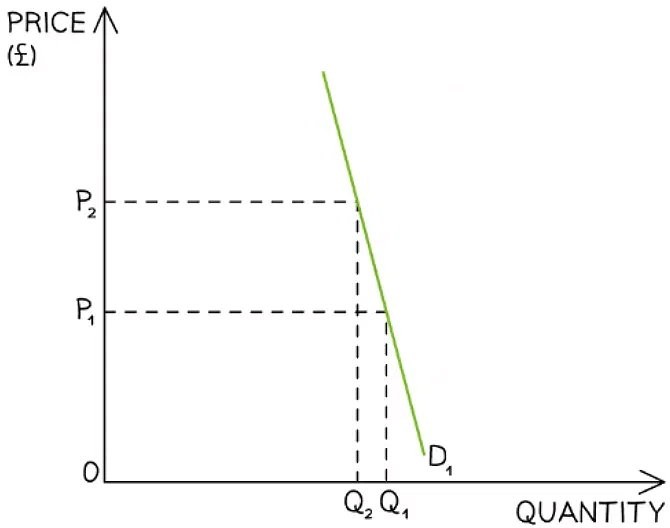
An illustration of price inelastic demand where a large increase in price from P1→P2 causes a small decrease in quantity demanded from Q1→ Q2
Diagram Analysis
- The demand curve is very inelastic in this market
- When a good/service is price inelastic in demand, there is a smaller than proportional decrease in the quantity demanded to an increase in price
- Total revenue is higher once the price has been increased
(P2 X Q2) > (P1 X Q1)
Example: A firm raises the price of its products from £10 to £15. Its sales have fallen from 100 to 40 units per day. Explain if they made the correct decision
Step 1: Calculate the initial sales revenue
Sales Revenue = Price of product X Quantity sold
= £ 10 x 100
= £ 1,000Step 2: Calculate the sales revenue after the price change
Sales Revenue = Price of product X Quantity sold
= £ 15 x 40
= £ 600Step 3: Explain the decision
By raising the price, the total revenue has fallen by £400. This indicates that the product is price elastic in demand and the firm should have lowered their price in order to maximise revenue
The Implications of PED for Stakeholders
- Knowledge of PED is important to firms seeking to maximise their revenue
- If their product is price inelastic in demand, they should raise their prices
- If price elastic in demand, then they should lower their prices
- Firms can choose to use price discrimination to maximise their revenue i.e. lower prices for certain segments & higher prices for others
- Knowledge of PED is important to Governments with regard to taxation and subsidies
- If they tax price inelastic in demand products, they can raise tax revenue without harming firms too much
- Consumers are less responsive to price changes so firms will pass on the tax to the consumer
- If Governments subsidise price elastic in demand products, there can be a greater than proportional increase in demand
|
23 videos|22 docs|1 tests
|


