Class 10 Exam > Class 10 Notes > Mathematics for GCSE/IGCSE > Probability Tree Diagrams
Probability Tree Diagrams | Mathematics for GCSE/IGCSE - Class 10 PDF Download

Tree Diagrams
What is a tree diagram?
- A tree diagram is utilized for:
- Displaying outcomes of sequential events
- Assisting in probability calculations involving AND and OR scenarios
- Tree diagrams are predominantly employed when an event has only two significant outcomes such as:
- "Rolling a 6 on a dice"
- "Not rolling a 6 on a dice"
- These outcomes are mutually exclusive, meaning they cannot occur simultaneously.
How do I draw and label a tree diagram?
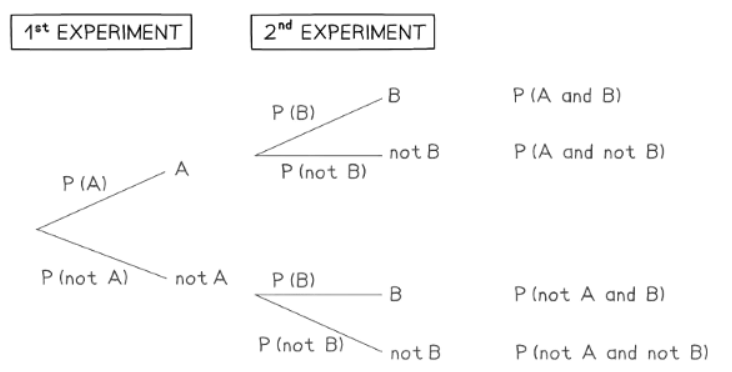
- The initial branches depict the results of the first experiment, which can be labeled as "A" and "not A".
- Two distinct sets of branches illustrate the outcomes of the second experiment:
- The first set continues from "A" in the first experiment.
- The second set continues from "not A" in the first experiment.
- The outcomes of the second experiment are broadly termed as "B" and "not B".
- Probabilities for each specific outcome are indicated along the branches of the tree diagram.
- At the conclusion of the diagram, various combinations of the two experiments are compiled, including:
- "A" and "B"
- "A and not B"
- "not A and B"
- "not A and not B"
How do I solve probability problems involving tree diagrams?
- Interpret questions in terms of AND and/or OR
- Draw, or complete a given, tree diagram
- Determine any missing probabilities
- often using 1 - P (A)
- Determine any missing probabilities
- Write down the outcomes of both events and work out their probabilities
- These are AND statements

- You may see this as “Multiply along branches”
- If more than one outcome is required then add their probabilities
- These are OR statements

- You may see this as “Add different outcomes”
- When you are confident with tree diagrams you can just pull out the outcome(s) you need
- you do not routinely have to work all of them out
How do I use tree diagrams with conditional probability?
- Conditional Probabilities in Tree Diagrams:
- Probabilities that depend on a prior event are called conditional probabilities.
- Example: A team's probability of winning or losing a game may change based on the outcome of their previous game.
- Identifying Conditional Probabilities in Tree Diagrams:
- Interested in the probability of winning after losing the previous game.
- This probability is found in the branches following the 'lose' outcome in the first set of branches.
- Drawing Tree Diagrams for Sequential Events:
- Example: Drawing two counters from a bag without replacement.
- Probabilities on the second set of branches depend on the outcome of the first draw.
- Adjusting Probabilities on Second Set of Branches:
- Denominators for the second set of probabilities decrease by one compared to the first set.
- Numerators also change based on the first event's outcome.
- Using Worked Examples:
- Look at worked examples to understand how conditional probabilities are calculated and represented.
- Identifying Conditional Probability Questions:
- Often introduced with "given that...".
- Example: "Find the probability that the team wins their next game given that they lost their previous game."
- Straight Bar Notation:
- Conditional probabilities are written using the 'straight bar' notation P(A∣B).
- Read as "the probability of A given B".
- Example: P(win∣lose) means the probability of winning given that they lost the previous game.
- Order of Events in Straight Bar Notation:
- The event after the straight bar occurs first.
- The event before the straight bar occurs afterward.
Combined Probability
What is Meant by Combined Probabilities?
- In general, combined probabilities involve considering more than one event.
- These events can be independent or mutually exclusive.
- They may also include events that follow on from previous events, such as rolling a dice followed by flipping a coin.
How do I work with and calculate combined probabilities?
- AND/OR Statements:
- Convert questions into probability statements using AND (for combined events) and OR (for alternative events).
- Example: "The probability of rolling a 6 followed by flipping heads" becomes "the probability of rolling a 6 AND flipping heads."
- Using AND and OR in Probability:
- AND means multiply (used for independent events).
- OR means add (used for mutually exclusive events).
- Total Probability Equals 1:
- The sum of all probabilities in a given scenario is 1.
- This is particularly useful for events happening or not happening.

- Tree Diagrams for Combined Probabilities:
- Tree diagrams help calculate combined probabilities, especially when considering two outcomes from each event.
- Example: The probability of being stopped at one set of traffic lights and also at a second set.
- Using Rules Without Diagrams:
- Unless specifically required, drawing a diagram is not necessary.
- Often quicker to consider possible outcomes and apply AND/OR rules directly without a diagram.
Question for Probability Tree DiagramsTry yourself: When are tree diagrams predominantly used?View Solution
The document Probability Tree Diagrams | Mathematics for GCSE/IGCSE - Class 10 is a part of the Class 10 Course Mathematics for GCSE/IGCSE.
All you need of Class 10 at this link: Class 10
|
66 videos|674 docs|19 tests
|
About this Document

Oct 23, 2025
Last updated
Related Exams
Document Description: Probability Tree Diagrams for Class 10 2025 is part of Mathematics for GCSE/IGCSE preparation.
The notes and questions for Probability Tree Diagrams have been prepared according to the Class 10 exam syllabus. Information about Probability Tree Diagrams covers topics
like Tree Diagrams, Combined Probability and Probability Tree Diagrams Example, for Class 10 2025 Exam. Find important definitions, questions, notes, meanings, examples, exercises and tests below for Probability Tree Diagrams.
Introduction of Probability Tree Diagrams in English is available as part of our Mathematics for GCSE/IGCSE
for Class 10 & Probability Tree Diagrams in Hindi for Mathematics for GCSE/IGCSE course.
Download more important topics related with notes, lectures and mock test series for Class 10
Exam by signing up for free. Class 10: Probability Tree Diagrams | Mathematics for GCSE/IGCSE - Class 10
Description
Full syllabus notes, lecture & questions for Probability Tree Diagrams | Mathematics for GCSE/IGCSE - Class 10 - Class 10 | Plus excerises question with solution to help you revise complete syllabus for Mathematics for GCSE/IGCSE | Best notes, free PDF download
Information about Probability Tree Diagrams
In this doc you can find the meaning of Probability Tree Diagrams defined & explained in the simplest way possible. Besides explaining types of
Probability Tree Diagrams theory, EduRev gives you an ample number of questions to practice Probability Tree Diagrams tests, examples and also practice Class 10
tests

Related Searches
Probability Tree Diagrams | Mathematics for GCSE/IGCSE - Class 10
,video lectures
,Probability Tree Diagrams | Mathematics for GCSE/IGCSE - Class 10
,Extra Questions
,practice quizzes
,Free
,Viva Questions
,MCQs
,past year papers
,mock tests for examination
,ppt
,study material
,Exam
,shortcuts and tricks
,Summary
,Sample Paper
,Important questions
,Previous Year Questions with Solutions
,Semester Notes
,Objective type Questions
,Probability Tree Diagrams | Mathematics for GCSE/IGCSE - Class 10
;


Additional Information about Probability Tree Diagrams for Class 10 Preparation
Probability Tree Diagrams Free PDF Download
The Probability Tree Diagrams is an invaluable resource that delves deep into the core of the Class 10 exam.
These study notes are curated by experts and cover all the essential topics and concepts, making your preparation more efficient and effective.
With the help of these notes, you can grasp complex subjects quickly, revise important points easily,
and reinforce your understanding of key concepts. The study notes are presented in a concise and easy-to-understand manner,
allowing you to optimize your learning process. Whether you're looking for best-recommended books, sample papers, study material,
or toppers' notes, this PDF has got you covered. Download the Probability Tree Diagrams now and kickstart your journey towards success in the Class 10 exam.
Importance of Probability Tree Diagrams
The importance of Probability Tree Diagrams cannot be overstated, especially for Class 10 aspirants.
This document holds the key to success in the Class 10 exam.
It offers a detailed understanding of the concept, providing invaluable insights into the topic.
By knowing the concepts well in advance, students can plan their preparation effectively.
Utilize this indispensable guide for a well-rounded preparation and achieve your desired results.
Probability Tree Diagrams Notes
Probability Tree Diagrams Notes offer in-depth insights into the specific topic to help you master it with ease.
This comprehensive document covers all aspects related to Probability Tree Diagrams.
It includes detailed information about the exam syllabus, recommended books, and study materials for a well-rounded preparation.
Practice papers and question papers enable you to assess your progress effectively.
Additionally, the paper analysis provides valuable tips for tackling the exam strategically.
Access to Toppers' notes gives you an edge in understanding complex concepts.
Whether you're a beginner or aiming for advanced proficiency, Probability Tree Diagrams Notes on EduRev are your ultimate resource for success.
Probability Tree Diagrams Class 10 Questions
The "Probability Tree Diagrams Class 10 Questions" guide is a valuable resource for all aspiring students preparing for the
Class 10 exam. It focuses on providing a wide range of practice questions to help students gauge
their understanding of the exam topics. These questions cover the entire syllabus, ensuring comprehensive preparation.
The guide includes previous years' question papers for students to familiarize themselves with the exam's format and difficulty level.
Additionally, it offers subject-specific question banks, allowing students to focus on weak areas and improve their performance.
Study Probability Tree Diagrams on the App
Students of Class 10 can study Probability Tree Diagrams alongwith tests & analysis from the EduRev app,
which will help them while preparing for their exam. Apart from the Probability Tree Diagrams,
students can also utilize the EduRev App for other study materials such as previous year question papers, syllabus, important questions, etc.
The EduRev App will make your learning easier as you can access it from anywhere you want.
The content of Probability Tree Diagrams is prepared as per the latest Class 10 syllabus.
|
© EduRev
|
Education Revolution
|


|


Signup on EduRev and stay on top of your study goals
10M+ students crushing their study goals daily