RD Sharma Solutions Ex-25.1, (Part - 2), Probability, Class 9, Maths | RD Sharma Solutions for Class 9 Mathematics PDF Download
Q8. The Blood group table of 30 students of class IX is recorded as follows:
A, B, O, O, AB, O, A, O, B, A, O, B, A, O, O
A, AB, O, A, A, O, O, AB, B, A, O, B, A, B, O
A student is selected at random from the class from blood donation. Find the probability that the blood group of the student chosen is:
1: A
2: B
3: AB
4: O
ANSWER
| BLOOD GROUP | A | B | O | AB | TOTAL |
| NUMBER OF STUDENTS | 9 | 6 | 12 | 3 | 30 |
1. Probability of a student having blood group 

2. Probability of a student having blood group 

3. Probability of a student having blood group 

4. Probability of a student having blood group 

Q9. Eleven bags of wheat flour, each marked 5kg, actually contained the following weights of flour (in Kg)
| 4.97 | 5.05 | 5.08 | 5.03 | 5.00 | 5.06 | 5.08 | 4.98 | 5.04 | 5.07 | 5.00 |
Find the probability that any of these bags chosen at random contains more than 5 kg of flour.
ANSWER:
Number of bags weighing more than 5kgs = 7
Total no of bags = 11
Probability of having more than 10kgs of rice 

Q10. The following table show the birth month of 40 students in class IX:
| JAN | FEB | MAR | APR | MAY | JUNE | JULY | AUG | SEP | OCT | NOV | DEC |
| 3 | 4 | 2 | 2 | 5 | 1 | 2 | 5 | 3 | 4 | 4 | 4 |
Find the probability that a student is born in October
ANSWER:
1. Probability that a student is born in the month of October 

Q11. Given below is the frequency distribution table regarding the concentration of SO2 in the air in parts per million of a certain city for 30 days.
| Concentration of SO2 | 0.00-0.04 | 0.04-0.08 | 0.08-0.12 | 0.12-0.16 | 0.16-0.20 | 0.20-0.24 |
| No of days | 4 | 8 | 9 | 2 | 4 | 3 |
Find the probability of the concentration of SO2 in the interval 0.12-0.16 on any of these days.
Answer:
Total no of days: 30
Probability of concentration of SO2 in interval 0.12-0.16 

Q12. A company selected 2400 families at random and surveys them to determine a relationship between income level and the number of vehicles in a home. The information gathered is listed below
VEHICLES PER FAMILY:
| Monthly Income | 0 | 1 | 2 | Above 2 |
| Less than 7000 | 10 | 160 | 25 | 0 |
| 7000-10000 | 0 | 305 | 27 | 2 |
| 10000-13000 | 1 | 535 | 29 | 1 |
| 13000-16000 | 2 | 469 | 29 | 25 |
| 16000 above | 1 | 579 | 82 | 88 |
If a family is chosen at random find the probability that the family is:
1. Earning Rs 10000 – 13000 per month and owning exactly 2 vehicles.
2. Earning Rs 16000 or more per month and owning exactly 1 vehicle.
3. Earning less than Rs 7000 per month and does not own any vehicle.
4. Earning Rs 13000 – 16000 per month and owning more than 2 vehicles.
5. Owning not more than 1 vehicle.
6.Owning at least one vehicle
Answer:
1. The probability that the family is earning 10000-13000 and is having exactly 2 vehicles

= 292/400
2. The probability that the family is earning 16000 or more and is having exactly 1 vehicle

3. The probability that the family is earning less than 7000 and is having no vehicle

4. The probability that the family is earning 13000-16000 and is having more than 2 vehicles

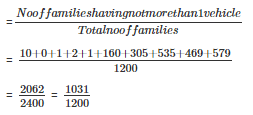
5. The probability that the family is having not more than one vehicle

6. The probability that the family is having atleast one vehicle


Q13. The following table gives the life time of 400 neon lamps:
| Life time | 300-400 | 400-500 | 500-600 | 600-700 | 700-800 | 800-900 | 900-1000 |
| bulbs | 14 | 56 | 60 | 86 | 74 | 62 | 48 |
A bulb is selected at random. Find the probability that the lifetime of a selected bulb:
1. Less than 400 hrs
2. between 300-800 hours
3. Atleast 700 hours
Answers:
Total number of bulbs = 400
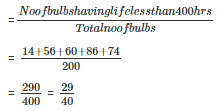
1. Probability that the life of the selected bulb is less than 400hrs

2. Probability that the life of the selected bulb is between 300-800hrs

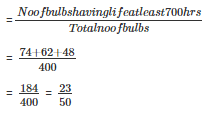
3. Probability that the life of the selected bulb is atleast 700hrs

Q14. Given below is the frequency distribution of wages (in Rs) of 30 workers in certain factory:
| Wages | 110-130 | 130-150 | 150-170 | 170-190 | 190-210 | 210-230 | 230-250 |
| No of workers | 3 | 4 | 5 | 6 | 5 | 4 | 3 |
A worker is selected at random. Find the probability that his wages are:
1. Less than Rs.150
2. Atleast Rs.210
3. More than or equal to 150 but less than 210
Answer
Total number of workers = 30
1. Probability that the worker wages are less than Rs.150


2. Probability that the worker wages are atleast Rs.210


3. Probability that the worker wages are more than or equal to 150 but less than 210


FAQs on RD Sharma Solutions Ex-25.1, (Part - 2), Probability, Class 9, Maths - RD Sharma Solutions for Class 9 Mathematics
| 1. What is the importance of learning probability in mathematics? |  |
| 2. How can probability be calculated? |  |
| 3. What is the difference between theoretical probability and experimental probability? |  |
| 4. How can probability be represented? |  |
| 5. What are the different types of probability? |  |


