Root Locus Diagram | Control Systems - Electrical Engineering (EE) PDF Download
| Table of contents |

|
| Uses of Root Locus |

|
| Advantages of Root Locus |

|
| Angle and Magnitude Condition of Root Locus |

|
| Graphical Method to determine the value of 'K' |

|
| Rules of Root Locus |

|
We have studied the stability of a system, it depends on the location of the roots of the characteristic equation also, the stability of the system depends on the location of closed-loop poles also.
- Such knowledge of the movement of the poles in the s-plane when the parameters are varied is important. The minor changes in the parameters can greatly help in the system designing. The nature of the system's transient response is closely related to the location of the poles in the s-plane.
- We have also studied the Routh Hurwitz criteria that describe the stability of the algebraic equation. If any of the term in the first column of the Routh table possesses a sign change, the system tends to become unstable.
The root locus method was introduced by W.R Evans in 1948. Root locus is a graphical method in which the movement of poles in the s-plane can be located when a specific parameter is varied from 0 to infinity. The parameter assumed to be varied is generally the gain of the system.
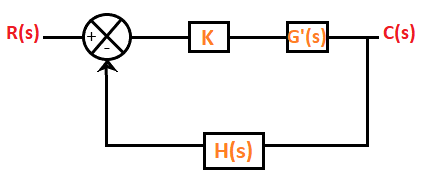
Consider the below closed loop system.

The equation of a closed loop system is given by:
1 + G(s)H(s) = 0
Where,
- G(s) is the gain of the transfer function
- H(s) is the feedback gain
In the case of root locus, the gain K is also assumed as part of the closed-loop system. K is known as system gain or the gain in the forward path.
The characteristic equation after including the forward gain can be represented as:
1 + KG'(s)H(s) = 0
Where,
G(s) = KG'(s)
When the system includes the variable parameter K, the roots of the closed loop system are now dependent on the values of 'K.'
The value of 'K' variable can vary in two cases, as shown below:

- In the first case, for every different value (integer or decimal) of K, we will get separate set of locations of the roots. If all such locations are joined, the resulting plot is defined as the root locus. We can also define root locus as the locus of the closed loop poles obtained when the system gain 'K' is varied from -infinity to infinity.
- When the K varies from zero to infinity, the plot is called the direct root locus. If the system gain 'K' varies from -infinity to zero, the plot thus obtained is known as inverse root locus. The gain K is generally assumed from zero to infinity unless specially stated.
Uses of Root Locus
In addition in determining the stability of the system, root locus also helps to determine:
- Damping Ratio
The damping ratio is a dimensionless unit that describes how the system decay affects the oscillations of the system. - Natural Frequency
It is represented by ωn. The value of the system gain K at the location of poles helps in computing the natural frequency and the damping ratio of the system. - P, PI, and PID Controllers
P (proportional), PI (Proportional Integral), and PID (Proportional Integral Derivative) controllers can be designed with the help of root locus technique. Here, the input of the system to be controlled is made proportional to the system gain K. - Lag and Lead Compensators
The compensators are the additional components in the system added to compensate for deficient performance. The phase lead compensator helps to shift the root locus towards the left in the complex s-plane, and it further increases the system's stability. Similarly, lag and lead compensators can be designed in various ways with the help of the root locus.
Advantages of Root Locus
- We can analyze the absolute stability of the system with the help of a root locus plot.
- Using the magnitude and angle conditions, we can find the limiting value of the system gain K for any point on the root locus.
- Enhances system designing with better accuracy.
- It helps in analyzing the stability of the system with time delay.
- Root locus plots help us determine the gain margin, relative stability, phase margin, and the system's settling time.
- The root locus technique is easy to implement as compared to other techniques in the control system.
- It helps in analyzing the performance of the control system.
Angle and Magnitude Condition of Root Locus
The root locus's angle conditions help us determine whether the given point exists on the root locus branch or not. We can find the value of the system gain 'K' with the help of the magnitude condition on the root locus.
For a general closed loop system, the characteristic equation is given by:
1 + G(s)H(s) = 0
G(s)H(s) = 0 - 1
G(s)H(s) = -1
We know that the s-plane is complex. Hence, the above equation in terms of a complex variable can be written as:
G(s)H(s) = -1 + j0
- Since the s-plane is complex, G(s)H(s) is also complex. For any value of 's' to be on the root locus, it must satisfy the above equation.
- Both sides of the above equation are in rectangular form, and we can equate the angle and magnitude of both sides after converting them into the polar form.
The two conditions of the root locus are angle condition and magnitude condition. Let's start.
1. Angle Condition
G(s)H(s) = -1 + j0
The above equation in terms of angle can be represented as:
Where,
q = 0, 1, 2 ...
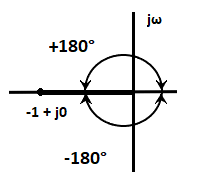
- The point -1 + j0 lies on the negative real axis point, which can be traced as a magnitude one at an angle of 180 degrees, 540 degrees, ... (2q + 1)180. These values can be calculated by putting the value of q = 0, 1, 2, and so on.
- For q = 0, we get 180 degrees and for q = 1, we get (2 + 1) x 180 = 540 degrees. Similarly, we can find further values.
The root locus plot of the point -1 + j0 is shown below:

Thus, we can define the angle condition as any value of the 's' for which the root of the equation (1 + G(s)H(s) = 0) is given by:
- The values of the angles are the odd multiples (1, 3, 5, 7, 9 ...) of 180 degrees.
- Any point on the s-plane to be on the root locus plot needs to satisfy the above condition. The angles calculated at the different values of 'q' should be the odd multiples of the positive or negative 180 degrees.
Uses of Angle Condition in Root Locus
The common use of the angle condition in root locus is to test any point in the s-plane. It is used to find if the given point exists or not.
2. Magnitude Condition
The magnitude condition is calculated by equating both the sides of the characteristic equation, which is given by:
1 + G(s)H(s) = 0
G(s)H(s) = -1
|G(s)H(s)| = |-1 + j0| = 1
- The system gain 'K' is unknown in the magnitude condition. We cannot find the magnitude of the point at any point in the s-plane. Thus, the condition is not suitable for checking the points' existence on the root locus plot. But, if the point in the s-plane is already satisfied using the angle condition, it needs to verify the magnitude condition as well.
- If the point is known to be on the root locus by the angle condition, the value of the system gain 'K' can also be found with the magnitude condition.
The magnitude condition is given by:
|G(s)H(s)| = 1
- The use of the magnitude condition depends on the point on the root locus, which is verified by the angle condition.
Uses of Magnitude Condition
The value of K can be determined with the help of magnitude condition, if the point is known to be on the root locus verified by the angle condition.
Consider the below example.
Example: Test whether the point -2 + 5j is present on the root locus or not. Consider the system with G(s)H(s) = K/s(s + 4).
We will first verify using the angle condition.
Angle and Magnitude condition of root locus
G(s)H(s) = K/s(s + 4)
Put s = -2 + j5, we get:
= K +j0/ (-2 + j5)(-2 + j5 + 4)
= (K +j0)/ (-2 + j5)(2 + j5)
Converting it into polar and considering angles, we get:
Angle G(s)H(s) = tan-10 - tan-1 (-5/2)- tan-1 (5/2) = 0-111.8 - 68.2 = -180 degrees
The resulted angle is the multiple of positive and negative value of 180 degrees. Thus, the angle condition is verified.
- The angle value of (-2 + 5j) = 111.8 degrees
- The angle value of (2 + 5j) = 68.2 degrees
We can use any scientific calculator to convert from rectangular to polar.
Now, we know that the given point -2 + 5j exists on the root locus.
We can use the magnitude condition, which is given by:
|G(s)H(s)| = 1
Value of G(s)H(s) at s = -2 +5j will be:
|K|/5.3851 X 5.3851 = 1
After solving, K = 29
Thus, s=-2 + 5j is one of the roots of the equation.
Graphical Method to determine the value of 'K'
To determine the value of the system gain K, we need a prior knowledge of the points on the root locus, i.e., the location of the point known to be on the root locus.
The value of K is given by:
K = product of phasor lengths drawn from the open loop poles up to a point on root locus/ product of phasor lengths drawn from the open loop zeroes up to a point on root locus
Consider the below example.
Example: Find the value of system gain K for the system G(s)H(s) = K/s(s + 4)
Given that a point -2 + j5 is already present on the root locus plot.
We are given that a point -2 + j5 is confirmed on the root locus.
The system G(s)H(s) = K/s(s + 4) has two poles and no zeroes. It is because the numerator has no. values of s.
Equating the denominator equal to zero, we get:
s(s + 4) = 0
s = 0 and s = -4
Thus, the open-loop poles are 0 and -4.
Now, we will join the points 0, -4, and -2 + j5, as shown below:
Angle and Magnitude condition of root locus
Length from s = 0 to the point = p
Length from s = -4 to the point = q
P = (22 + 52)1/2
P = (29)1/2
Similarly, q = (22 + 52)1/2
q = (29)1/2
We know,
K = product of phasor lengths drawn from the open-loop poles up to a point on root locus/ product of phasor lengths drawn from the open-loop zeroes up to a point on root locus
Since, there is no open-loop zero, the value of the denominator will be assumed as unity.
K = p x q = 29
Rules of Root Locus
Here, we will discuss the six basic rules required to plot a root locus. We will also discuss an example that will help us to implement the rules easily.
Rule Number 1
- We know that the root of the equation can be real or complex or a combination of both. The root locus is generally symmetric about the real axis. Thus, the plot needs to be symmetric about the real axis of the s-plane.
Rule Number 2
- The transfer function of the system is generally represented by G(s)H(s), where H(s) is the feedback path. Let us suppose the open-loop transfer function to be the same G(s)H(s) and the poles and zeroes are P and Z.
There are two conditions where the poles can be greater than the number of zeroes, or the number of zeroes can be greater than the number of poles in the given characteristic equation.
Let the number of branches in the root locus is N. Both the cases arise when we plot the root locus. The default conditions are given for each case that helps in determining the number of branches terminating or approaching infinity.
Case 1: P > Z
- In the above case, we assume that the number of branches in the root locus will equal the number of open-loop poles. It is because the numbers of poles are greater here.
(N = P) - Branches, in this case, will start from the location of the open-loop poles. Here, out of a number of branches at P, the Z number of branches will terminate at the location of open-loop zeroes. The remaining branches (P - Z) will approach infinity.
For example,
Let P = 3, and Z = 1
Then,
The number of root locus branches = 3 = no. of poles
P - Z = 3 - 1 = 2
It means that 3 branches will start from the location of open loop poles
No. of branches terminating at the open loop zero location = 1
No. of branches approaching to infinity = P - Z = 2
Case 2: Z > P
- In the above case, we assume that the number of branches in the root locus will be equal to the number of open loop zeroes. It is because the numbers of zeroes are greater here. (N = Z)
- Branches in this case will terminate at the finite location of the open loop zeroes. Here, out of number of branches at Z, the P number of branches will start at the location of open loop poles. The remaining branches (Z - P) will approach to finite zeroes originating from the infinity.
For example,
Let P = 1, and Z = 3
Then,
The number of root locus branches = 3 = no. of zeroes
Z - P = 3 - 1 = 2
It means that 1 branch will start from the location of open loop poles
No. of branches terminating at the finite open loop pole location = 3 = all the root locus branches
No. of branches originating from infinity = Z - P = 2
Rule Number 3
- A point on the root locus is said to exist if the sum of the open loop poles and zeroes on the real axis towards the right hand side is odd with respect to that point.
For example,
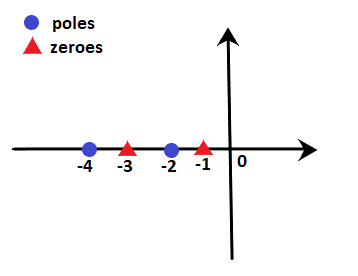
Let poles be -2 and -4, and zeroes are -1 and -3. We need to find that points -2.2 and -3.4 lies on the root locus or not.
We know that -2.2 lies between -2 and -3, while point -3.4 lies between -3 and -4.

We know that -2.2 lie between -2 and -3, while point -3.4 lies between -3 and -4.
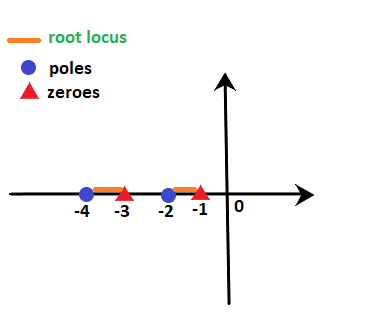
- Point -2.2: At point -2.2, the sum of poles and zeroes on the right-hand side is 2, i.e. 1 pole and 1 zero. It means that the sum is even. According to rule number 3, the sum should be odd. Hence, point -2.2 does not lie on the root locus. We can also say that any point between -2 and -3 will not lie on the root locus.
- Point -3.4: At point -3.4, the sum of poles and zeroes on the right-hand side is 3, i.e. 1 pole and 2 zeroes. It means that the sum is odd. According to rule number 3, the sum should be odd. Hence, point -3.4 lie on the root locus. We can also say that any point between -3 and -4 will lie on the root locus.
The area of the root locus between the points is shown below:

Here, orange line represents the area where root locus lies.
Let's consider an example for better understanding.
Example: G(s)H(s) = K(s + 1)(s + 4)/ s(s + 3)(s + 5). Find on which sections of the real axis, the root locus exists.
We know that the denominator signifies the poles, and the numerator signifies the zeroes. Thus, 0, -3, and -5 are the poles, and -1 and -4 are the zeroes per the given transfer function. It means that there are 3 poles and 2 zeroes.
These poles and zeroes on the real axis will appear as:
According to rule number 3,
- The sections between 0 and -1 (for example, point -0.4) contain only one pole and no zeroes on the right-hand side. It means that the sum is odd (i.e. 1). So, it exists on the root locus.
- The sections between -1 and -3 (for example, point -2.1) contain only one pole and one zero on the right-hand side. It means that the sum of poles and zeroes is even (i.e. 2). So, it does not exist on the root locus.
- The sections between -3 and -4 (for example, point -3.5) contain two poles and one zero on the right-hand side. It means that the sum is odd (i.e. 3). So, it exists on the root locus.
- The sections between -4 and -3 (for example, point -4.3) contain two poles and two zeroes on the right-hand side. It means that the sum of poles and zeroes is even (i.e. 4). So, it does not exist on the root locus.
- The sections greater than -5 (for example, point -8.6) contain three poles and two zeroes on the right-hand side. It means that the sum is odd (i.e. 5). So, it exists on the root locus.
Thus, the line marked with orange depicts the sections where the root locus exists. It is shown below:
Rule Number 4
We have already discussed that (P - Z) provides the number of branches approaching infinity for the given transfer function. The information about such branches approaching infinity is defined under rule number 4, known as asymptotes.
The angle of such asymptotes is given by:
= (2q + 1)180 / P - Z
Where,
q = 0, 1, 2, 3, 4 ... (P - Z - 1)
These are always symmetric about the real axis.
Rule Number 5
Rule number 4 describes the guidelines or information about the branches approaching infinity, known as the asymptotes. But, the angles are insufficient to plot the root locus, and the location of such branches in the s-plane is equally important, defined by rule number 5.
Centroid is a point where the asymptotes intersect at a common point on the real axis. It can be calculated as:

Rule Number 6
The last rule is the breakaway point. It is also a point on the root locus where multiple roots of the given equation occurs. It is calculated for a specific value of system gain K.
Or
It can be defined as a point on the root locus where two or more roots occur for a particular value of K.
The root locus branches always leave breakaway points at an angle of 180/n.
Where,
N = number of branches approaching at the breakaway point.
The value of the angle can be positive or negative.
Let's discuss some predictions about the existence of the breakaway points:
- There exists atleast one breakaway point between the adjacent placed poles if the section between the two poles lies on the root locus.
For example,
G(s)H(s) = K/s(s + 3)
The above transfer function has two poles at 0 and -3. According to rule number 3, the point on the section between 0 and -3 (for example, point -2.2) has one pole and no zero on the right-hand side. It signifies that the sum of zeroes and poles is 1, i.e. odd. Thus, the section between 0 and -3 exists of the root locus.
Hence, there must exist a minimum of one breakaway point in between them.
|
53 videos|73 docs|40 tests
|

|
Explore Courses for Electrical Engineering (EE) exam
|

|


