Runoff & Hydrographs | Engineering Hydrology - Civil Engineering (CE) PDF Download
Hydrograph
- A plot of the discharge in a stream plotted against time chronologically is called a hydrograph. OR
- Special graphs that show changes in a river’s discharge over a period of time, usually in relation to a rainfall event. OR
- A hydrograph is a graph showing the rate of flow (discharge) versus time past a specific point in a river, or other channel or conduit carrying flow. The rate of flow is typically expressed in cubic meters or cubic feet per second (m3/s).
Basic Terms
The discharge is measured at a specific point in a river and is typically time variant.
- Rising limb: The rising limb of hydrograph, also known as concentration curve, reflects a prolonged increase in discharge from a catchment area, typically in response to a rainfall event
- Recession (or falling) limb: The recession limb extends from the peak flow rate onward. The end of storm flow (quick flow or direct runoff) and the return to groundwater-derived flow (base flow) is often taken as the point of inflection of the recession limb. The recession limb represents the withdrawal of water from the storage built up in the basin during the earlier phases of the hydrograph.
- Peak discharge: The highest point on the hydrograph when the rate of discharge is greatest
- Lag time: The time interval from the centre of mass of rainfall excess to the peak of the resulting hydrograph
- Time to peak: Time interval from the start of the resulting hydrograph
- Discharge: The rate of flow (volume per unit time) passing a specific location in a river or other channel
Factors affecting hydrograph shape
- Drainage characteristics: Basin area, basin shape, basin slope, soil type and land use, drainage density, and drainage network topology. Most changes in land use tend to increase the amount of runoff for a given storm.
- Rainfall characteristics: Rainfall intensity, duration, and their spatial and temporal distribution; and storm motion, as storm moving in the general downstream direction tend to produce larger peak flows than storms moving upstream.
Why Construct & Analyse Hydrographs?
- To find out discharge patterns of a particular drainage basin
- Help predict flooding events, therefore influence implementation of flood prevention measures
Relation rainfall - runoff
A rainfall defined in time and space that falls on a catchment produces a hydrograph.
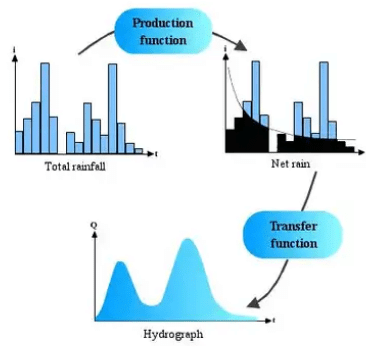
Given figure defines certain essential elements of the hydrograph resulting from a hyetograph( Rainfall intensity vs. time).
To describe the processes that occur when the rain is transformed into a flow hydrograph (by Horton's postulate), we apply two functions called production function and transfer function. The production function allows determination of the net rain hyetograph starting from the total rain. The transfer function allows determination of the hydrograph resulting from the net rain. The net rain represents the part of total rain that contributes to the flow process.
The hydrograph is represented by an asymmetric curve. Peak flow is represented by the following formula:
Qp = C.i.A
It can be defined:
- Response time of the catchment tr - represents the time interval that separates the net rain gravity centre from the peak flow or sometimes the gravity centre of the flow hydrograph.
- Time of concentration tc - is the time required by rain fallen on the catchment to flow from the farthest point to the measuring point of the river. Thus, after time tc from the beginning of the rainfall, the whole catchment is considered to contribute to the flow. The value of i, the main intensity, assumes that the rate of rainfall is constant during tc, and that all measured rainfall over the area contributes to the flow. The peak flow Qp occurs after the period tc.
- Rising limb tm - is the time from the beginning of the rain to the peak of the hydrograph
- Base time tb - represents the direct flow duration.
- Time to Peak tp - Time from the beginning of the rising limb to the occurrence of the peak discharge
Total streamflow during a precipitation event includes the baseflow existing in the basin prior to the storm and the runoff due to the given storm precipitation. Total streamflow hydrographs are usually conceptualised as being composed of:
- Direct Runoff, which is composed of contributions from surface runoff and quick interflow. Unit hydrograph analysis refers only to direct runoff.
- Baseflow, which is composed of contributions from delayed interflow and groundwater runoff.
- Surface runoff includes all overland flow as well as all precipitation falling directly onto stream channels. Surface runoff is the main contributor to the peak discharge.
- Interflow is the portion of the streamflow contributed by infiltrated water that moves laterally in the subsurface until it reaches a channel. Interflow is a slower process than surface runoff. Components of interflow are quick interflow, which contributes to direct runoff, and delayed interflow, which contributes to baseflow.
- Groundwater runoff is the flow component contributed to the channel by groundwater. This process is extremely slow as compared to surface runoff.
Types of hydrograph can include:
- Storm/Flood hydrographs: A storm hydrograph is a way of displaying how the discharge of a river can change over time in response to a rainfall event. The discharge of a river is just the amount of water passing a certain point every second and is calculated by multiplying the cross-sectional area of the river by its velocity
- Annual hydrographs
- Direct Runoff Hydrograph: Direct runoff hydrograph(DRH) resulting from one unit (e.g., 1 cm) of effective rainfall occurring uniformly over that watershed at a uniform rate over a unit period of time
Unit Hydrograph
This method was first suggested by Sherman in 1932 and has undergone many refinements since then.
- A unit hydrograph is defined as they hydrograph of direct runoff resulting from one unit depth (1 cm) of rainfall excess occurring uniformly over the basin and at a uniform rate for a specified duration (D hours). OR
- A unit hydrograph (UH) is the hypothetical unit response of a watershed (in terms of runoff volume and timing) to a unit input of rainfall. It can be defined as the direct runoff hydrograph (DRH) resulting from one unit (e.g.,1 cm) of effective rainfall occurring uniformly over that watershed at a uniform rate over a unit period of time. As a UH is applicable only to the direct runoff component of a hydrograph (i.e., surface runoff), a separate determination of the baseflow component is required. OR
- It can be defined as the direct runoff hydrograph (DRH) resulting from one unit (e.g., 1 cm) of effective rainfall occurring uniformly over that watershed at a uniform rate over a unit period of time.
A UH is specific to a particular watershed and specific to a particular length of time corresponding to the duration of the effective rainfall. That is, the UH is specified as being the 1-hour, 6-hour, or 24-hour UH, or any other length of time up to the time of concentration of direct runoff at the watershed outlet. Thus, for a given watershed, there can be many unit hydrographs, each one corresponding to a different duration of effective rainfall
The following are essential steps in deriving a unit hydrograph from a single storm:
- Separate the baseflow and obtain the direct runoff hydrograph (DRH).
- Compute the total volume of direct runoff and convert this volume into the equivalent depth of effective rainfall (in 1 cm) over the entire basin.
- Normalize the direct runoff hydrograph by dividing each ordinate by the equivalent volume (cm) of direct runoff (or effective rainfall)
- Determine the effective duration of excess rainfall. To do this, obtain the effective rainfall hyetograph (e.g., use the φ-index, the Horton) and its associated duration. This duration is the duration associated with the unit hydrograph
Unit hydrographs are fundamentally linked to the duration of the effective rainfall event producing them. They can only be used to predict direct runoff from storms of the same duration as that associated with the UH, or from storms which can be described as a sequence of pulses, each of the same duration as that associated with the UH.
Unit Hydrographs for Different Effective Duration
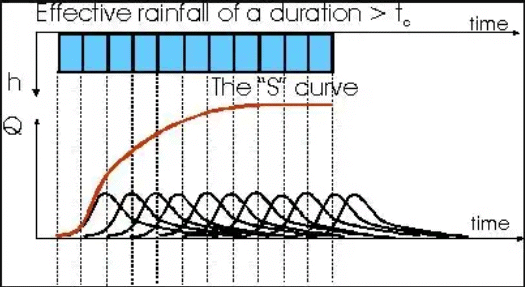
A unit hydrograph for a particular watershed is developed for a specific duration of effective rainfall. When dealing with a rainfall of different duration a new unit hydrograph must be derived for the new duration. The linearity property implicit in the UH analysis can be used to generate UH’s associated with larger or smaller effective rainfall pulse duration. This procedure is sometimes referred to as the S-curve Hydrograph method.
- S-Curve Hydrograph Method
An S-hydrograph represents the response of the basin to an effective rainfall event of infinite duration. Assume that a UH of duration D is known and that a UH for the same basin but of duration D’ is desired. The first step is to determine the S-curve hydrograph by adding a series of (known) UH’s of duration D, each lagged by a time interval D. The resulting superposition represents the runoff resulting from a continuous rainfall excess of intensity 1/D.
Lagging the S-curve in time by an amount D’ and subtracting its ordinates from the original unmodified S-curve yields a hydrograph corresponding to a rainfall event of intensity 1/D and of duration D’. Consequently, to convert this hydrograph whose volume is D’/D into a unit hydrograph of duration D’, its ordinates must be normalized by multiplying them by D/D’. The resulting ordinates represent a unit hydrograph associated with an effective rainfall of duration D’
A hydrologic system (a basin) is said to be a linear system if the relationship between storage, inflow, and outflow is such that it leads to a linear differential equation.
Assumptions
- Time invariance: The first basic assumption is that the direct-runoff response to a given effective rainfall in a catchment is time invariant. This implies that the DRH for a given ER in a catchment is always the same irrespective of when it occurs.
- Linear Response: The direct-runoff response to the rainfall excess is assumed to be linear. This is the most important assumptions of the unit-hydrograph theory. Linear response means that if an input X1(t) cause an output y1(t) an output x2(t) causes an output y2(t) then an input x1(t) + x2(t) gives an output y1(t) + y2(t). Consequently if x2(t) = rx1(t), then y2(t) = r1y1(t). Thus, if the rainfall excess in a duration D is r times the unit depth, the resulting DRH will have ordinates bearing ratio r to those of the corresponding D-h unit hydrograph.
t'B = tB + (n - 1)D
Where,
t'B = The base period of T hr U.H
tB = Base period of D hr U.H
Also, T>D
T = n.D where ‘n’ is an integer.
Synthetic Hydrograph
A synthetic unit hydrograph retains all the features of the unit hydrograph but does not require rainfall-runoff data. A synthetic unit hydrograph is derived from theory and experience, and its purpose is to simulate basin diffusion by estimating the basin lag based on a certain formula or procedure.
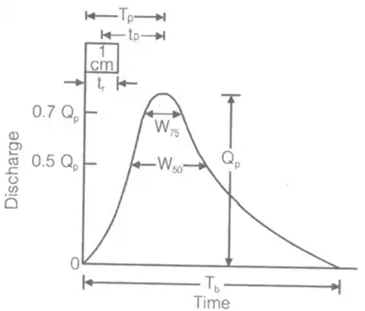
Synder’s Method: Synder (1938), based on a study of a large number of catchment in the Appalachian Highlands of eastern United States developed a set of empirical equations for synthetic unit hydrograph in those areas. These equations are in use in the USA. And with some modifications in many other countries, and constitute what is known as Synder’s synthetic unit hydrograph. (i) tp = Ct[L . Lca]0.3
Where,
tp = Time interval between mid-point of unit rainfall excess and peak of unity hydrograph in hour
L = Length of main stream
LCa = The distance along the main stream from the basin outlet to a point on the stream which is nearest to the centrod of basis (in KM)
Ct = Regional constant 0.3 < Ct 0.6
S = Basin slope.
N = Constant = 0.38.
tr = Standard duration of U.H in hour
Where, Cp = Regional constant = 0.3 to 0.92.
A = Area of catchment in km2.
QPS = Peak discharge in m3/s.
(v) t'p = 0.955 tp+ 0.25 tr
where, tR = standard rainfall duration.
t'P = Basin lag for non-standard U.H.
(vii) tB = (72 + 3tP/)hour,
for a large catchment.
Where,
tB = Base time of synthetic U.H for the small catchment.
W50 = width of U.H in hour at 50% peak discharge.
(ix) W75 = (W50)/1.75
W75 = Width of U.H in hours at 75% peak discharge.
(x) q = QP/A
where, QP = Peak discharge in m3/sec.
A = Area in km2.
|
20 videos|36 docs|30 tests
|
FAQs on Runoff & Hydrographs - Engineering Hydrology - Civil Engineering (CE)
| 1. What is a hydrograph and how is it related to runoff? |  |
| 2. What are the factors that influence the shape of a hydrograph? |  |
| 3. How can hydrographs be used in civil engineering? |  |
| 4. What are the different components of a hydrograph? |  |
| 5. How can hydrographs help in understanding the impact of land use changes on runoff? |  |

|
Explore Courses for Civil Engineering (CE) exam
|

|


