Practice Questions for Sets | CSAT Preparation - UPSC PDF Download

Introduction
A venn diagram is used to visually represent the relationship between various sets.
What do each of the areas in the figure represent?
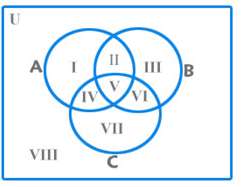
I – only A;
II – A and B but not C;
III – Only B;
IV – A and C but not B;
V – A and B and C;
VI – B and C but not A;
VII – Only C
n(A U B U C) = n(A) + n(B) + n(C) — n(A n B) — n(A n C) – n(B n C) + n(A n B n C)
As per the above diagram,
n(A) = I + II + IV + V
n(B) = II + III + V + VI
n(C) = IV + V + VI + VII
n(A n B) = II + V
n(B n C) = V + VI
n(C n A) = IV + V
n(A n B n C) = V
n(A U B U C) = I + II + III + IV + V + VI + VII
Note: While doing such questions, it is advisable that you take the least no. of variables to fill up the empty space. As a practice, if n(A n B n C) is missing, take that as ‘x’ and proceed.
For Maximum and Minimum of values, the key point to note is: If you allot a value to the intersection, it will get added to all the individual sets but will bring down the total.
Solved Examples
Example 1: After school, 20 students play soccer, 10 play basketball, and 7 play both. How many students play basketball, soccer or both?
Ans: Method 1: Draw a diagram. First put the overlap into the diagram. Then calculate the number in each subset.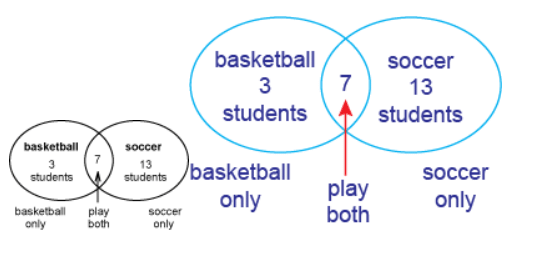
For only playing basketball, 10 − 7 = 3. For only playing soccer, 20 − 7 = 13.
So the total number of players is basketball only + soccer only + both = 3 + 13 + 7 = 23.
Method 2: Another method to find the total number in a set is to add the number in each subset and subtract the number in the intersection.
subset + subset − intersection = total elements in set
20 + 10 − 7 = 23
Example 2: Out of 50 people at a buffet dinner, 14 chose ice cream for dessert, 25 chose chocolate cake, and 5 chose both.
(a) How many people had dessert?
(b) How many people chose not to have dessert?
(b) What percent of the people at the dinner had only cake?
Ans: Draw a diagram. First put the overlap number into the diagram. The 5 people who had both are included in both of the 2 sets. Then calculate the number in each subset.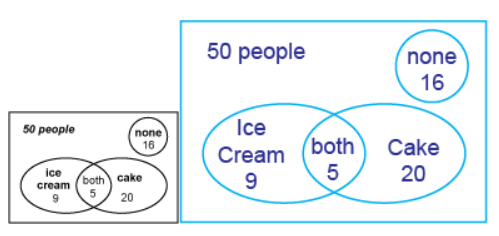
For the number of people who only had ice cream, subtract the people who had both.
14 − 5 = 9
For the number of people who only had cake, 25 − 5 = 20.
(a) The number of people who had dessert is 20 + 5 + 9 = 34.
(b) Out of the 50 people, 50 − 34 = 16 people did not have dessert.
(c) The diagram shows 20 people had only cake, out of the 50 people at the dinner.
So it is 20/50 = 40/100 = 40%.
Example 3: Collins did a survey in his class about what pets the students owned. The most popular pet was a dog, with 22 students having dogs. There were 16 students with cats. Nine students have other types of pets. For students with more than one pet, 6 have a dog and a cat, 4 have a dog and another type of pet, and 3 have a cat with another type of pet. Two students have dogs, cats and another pet. If the class has 40 students, what percentage of students have no pets?
Ans: Draw a diagram.
First put the overlap number into the diagram. Calculate the number in each subset by subtracting the numbers already in the intersection.
all 3 pets = 2 people
cat and dog = 6 – 2 = 4
dog and other = 4 – 2 = 2
cat and other = 3 – 2 = 1
cat only = 16 – 4 – 1 – 2 = 9
dog only = 22 – 4 – 2 – 2 = 14
other type only = 9 – 2 – 1 – 2 = 4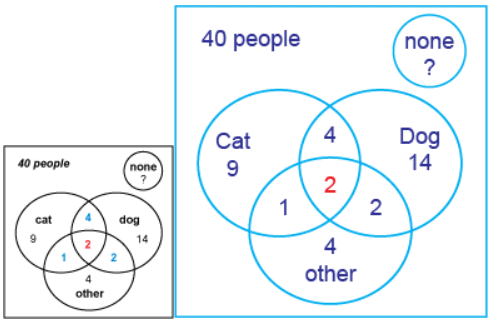
The total number of students in the circles is
9 + 4 + 14 + 1 + 2 + 2 + 4 = 36
If there are 40 students in the class, 40 – 36 = 4 students have no pets.
4 out of 40 = 4/40 = 1/10 = 10/100.
10% of the students have no pets.
Example 4: Students were surveyed about their summer plans. In all, 175 said they were planning to work, 120 said they planned to study and 105 said they were going to relax. No students said they planned to do all 3. If 150 students said they planned to do just 2, how many students plan to do just 1?
Ans: Draw a diagram. You are looking for the areas that are not intersections of the plans.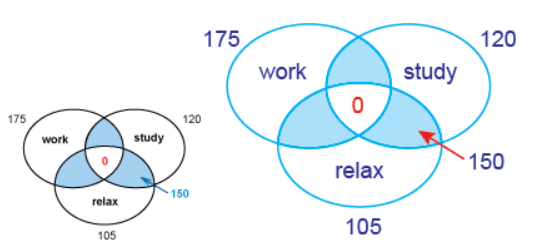 Notice that the intersections are each counted twice:
The intersection of work and relax is included in the total count of work (175) and in the total count of relax (105).
So the answer is the number of students in each set minus twice the sum of the intersections.
175 + 120 + 105 − 2(150) = 400 − 300 = 100
Example 5: (a) How many elements are in the set of integers from 5 to 20?
(b) What is the sum of the set of integers from 5 to 20?
Ans: (a) You might think you just subtract. Last − first = 15 − 5 = 10. But make a list.
{5, 6, 7, 8, 9, 10, 11, 12, 13, 14, 15} = 11 elements
Note: The formula for the number of consecutive integers in a sequence is (last − first) + 1, or L − F + 1.
(b) The first thing to notice is the sums of the pairings of the first and last elements of the set.
(first + last) = 5 + 15 = 20
(second + second to last) = 6 + 14 = 20
To use this pairing, you need to know the number of elements. For this set, there are 11 elements.
The sum will be (11 / 2)(20) = 5.5 × 20 = 110.
Example 6: Set M = {20, 70, 10, k, 20, 90}. The arithmetic mean is 45. What is the mode of the set?
Ans: Arithmetic mean: sum of elements/number of elements
Mode: the element that appears the most times in a set.
To find the value of k, use the arithmetic mean.
45 = 20 + 70 + 10 + k + 20 + 90/6
45 = 210 + k/6
45 × 6 = 210 + k
k = 270 – 210 = 60
With k = 60, rewrite the elements of the set in numerical order.
{10, 20, 20, 60, 70, 90}
The mode is 20, since it is the only element that appears more than once.
Notice that the value of k is given as an answer option. A GMAT trick is to offer an answer option that is a number from a previous step in finding the real answer. The median is also given as an answer option. Since the number of elements is even, the median is the mean of the 2 center elements: (20 + 60)/2 = 40.
Example 7: An opened box contains 3 to 5 bottles of mushrooms. Each bottle contains 30 to 40 mushrooms. If 10% of the mushrooms are flawed, what is the range of the possible number of flawed mushrooms in the box?
Ans: First find the lowest value.
Three bottles and 30 mushrooms is the fewest number of mushrooms in the box.
3 × 30 × 10% = 90 × 0.1 = 9 At least 9 flawed mushrooms.
Then find the greatest value.
Five bottles and 40 mushrooms is the greatest number of mushrooms in the box.
5 × 40 × 10% = 200 × 0.1 = 20 At most 20 flawed mushrooms.
There are between 9 and 20 flawed mushrooms in the bottles in the box.
Example 8: Set A = {1, 2, 3, 4} and set B = {integers > 5}.
What is the range of values for the product of elements ab?
Ans: Find the minimum values and multiply.
The minimum value in set A is 1 and the minimum value in set B is 6, so the minimum for ab is 1 × 6 = 6.
Find the maximum values and multiply.
The maximum value in set A is 4. Set B has no maximum, so ab has no maximum.
The range values for the product of Set A and Set B is ab > 6.
Example 9: In a survey, it was found that 80% like tea whereas 70% like coffee. What is the maximum and the minimum number of those who like both?
Ans: First thing to note is that no information is mentioned about the people who don’t like either of them. So that value is flexible and can change.
n(tea) = 80
n(coffee) = 70
n(total) = 100 {This includes those who like neither.}
n(tea n coffee) = ??? {We don’t know this value and it is flexible}
If we want to maximize those who like both, we have to maximize the value in the intersection. So, we have to minimize the value of the union.
n(tea n coffee)max = 70 {It is limited by the higher of the two values}
In this case, our Venn diagram will look something like this (Red is tea & Purple is coffee):
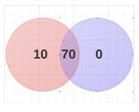
In this case 20% of people like neither tea nor coffee.
If we want to minimize those who like both, we have to minimize the value in the intersection. So, we have to maximize the value of the union. We know that the maximum possible value of the union ie n(tea U coffee) = 100
So, we need to figure out the surplus : n(tea) + n(coffee) = 80 + 70 = 150.
The surplus is = 150 – 100 = 50
So, the value of the intersection = value of the surplus = 50
This could have also been obtained by the formula
n(a U b) = n(a) + n(b) – n (a n b)
In this case, our Venn diagram will look something like this (Red is tea & Purple is coffee):
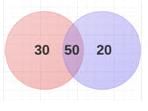
In this case, there is no one who likes neither coffee nor tea.
Let us look at a slightly more complicated problem when we have to deal with three sets and the value of the union of the sets is fixed.
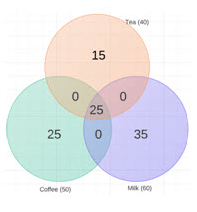
Example 10: In a survey, it was found that 40 % like tea, 50 % like coffee and 60 % like milk. Every person likes at least one of the three items – tea/coffee/milk. What are the maximum and minimum possible values of those who like all three?
Ans: Currently our Venn Diagram looks like this:
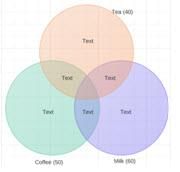
First of all, we need to figure out the surplus.
Surplus = 40 +50 + 60 – 100 = 50
The surplus should be taken care of by adding to the intersection of all three or any of the two.
If we want to maximize those who like all three, we need to maximize the intersection of all three.
Adding ‘1’ to the intersection of all three takes care of a surplus of ‘2’. To take care of a surplus of 50, we need to make
n (tea n coffee n milk) = 25
Note: If the union of the sets was not fixed i.e. the line ‘Every person likes at least one of the three items – tea/coffee/milk’ was not given in the question then the answer would have been 40.
Our Venn diagram will now look like this:
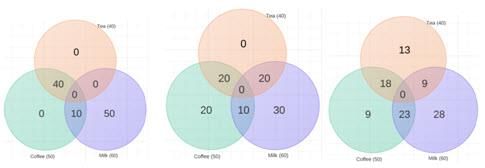
If we want to minimize those who like all three, we need to minimize the intersection of all three. But we have to take care of the surplus of 50. We can do that by adding them to the intersection of any two of them. Adding ‘1’ to the intersection of two sets takes care of a surplus of ‘1’. So,
n (tea n coffee n milk)min = 0
We can take care of the surplus 50 in many ways by adding them in any order to the intersection of two sets. Three of those many ways are given below in Venn Diagrams.
|
205 videos|264 docs|136 tests
|
FAQs on Practice Questions for Sets - CSAT Preparation - UPSC
| 1. What are sets? |  |
| 2. How are sets represented? | |
| 3. What is the cardinality of a set? | |
| 4. What is the intersection of two sets? | |
| 5. How is the union of two sets defined? | |


study material
,Exam
,practice quizzes
,Viva Questions
,mock tests for examination
,shortcuts and tricks
,video lectures
,Previous Year Questions with Solutions
,Objective type Questions
,ppt
,Important questions
,MCQs
,Practice Questions for Sets | CSAT Preparation - UPSC
,Practice Questions for Sets | CSAT Preparation - UPSC
,Summary
,past year papers
,Practice Questions for Sets | CSAT Preparation - UPSC
,Extra Questions
,Free
,Sample Paper
,Semester Notes
;


Practice Questions for Sets Free PDF Download
Importance of Practice Questions for Sets
Practice Questions for Sets Notes
Practice Questions for Sets UPSC
Study Practice Questions for Sets on the App
|
© EduRev
|
Education Revolution
|


|


