Class 8 Maths Chapter 13 Question Answers - Introduction to Graphs

Q1: Draw the graph of the following table. Is it a linear graph?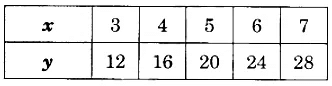 Ans:
Ans: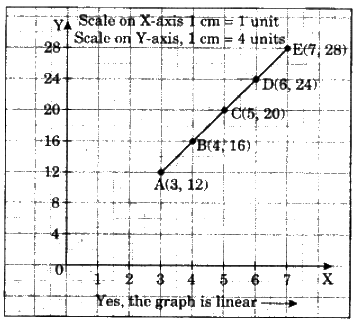
Q2: The given graphs show the progress of two different cyclists during a ride. For each graph, describe the rider’s progress over the period of time.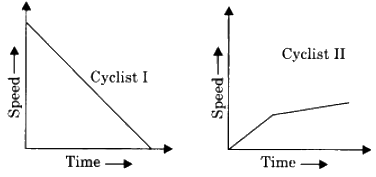 Ans: (a) As time passes, the speed of cyclist I decreases steadily.
(b) Speed of cyclist II increases for a short time period, and then increases very slowly.
Q3: A bank gives 10% interest on the deposits by the Ladies. Draw a graph showing the relation between the amount deposited and the simple interest earned by the ladies and state following from the graph.
(i) The annual interest earned for an investment of ₹ 250
(ii) The investment one has to make to get an annual interest of ₹ 70.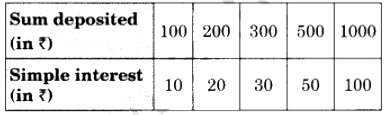 Ans:
Ans: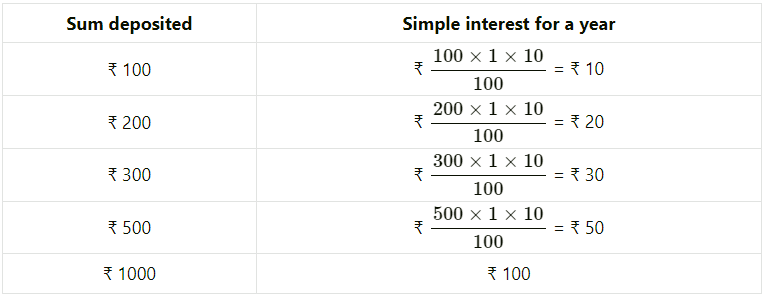
We get a table of values.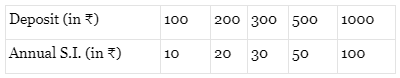
(i) Scale : 1 unit = ₹ 100 on horizontal axis; 1 unit = ₹ 10 on vertical axis.
(ii) Mark Deposits along the horizontal axis.
(iii) Mark Simple Interest along the vertical axis.
(iv) Plot the points : (100,10), (200, 20), (300, 30), (500,50) etc.
(v) Join the points. We get a graph that is a line.
Corresponding to ₹ 250 on the horizontal axis, we get the interest to be ₹ 25 on the vertical axis.
Corresponding to ₹ 70 on the vertical axis, we get the sum to be ₹ 700 on the horizontal axis.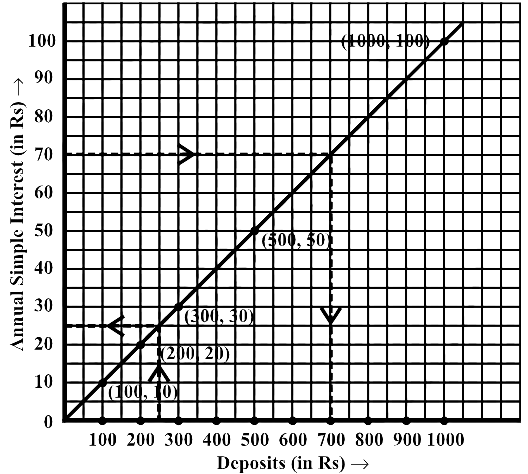
Q4: From the given figure, choose the letters indicate the location of the points.
(i) (3, 1)
(ii) (0, 5)
(iii) (3, 0)
(iv) (1, 2)
(v) (2, 3)
(vi) (8, 12)
(vii) (6, 10)
(viii) (0, 9)
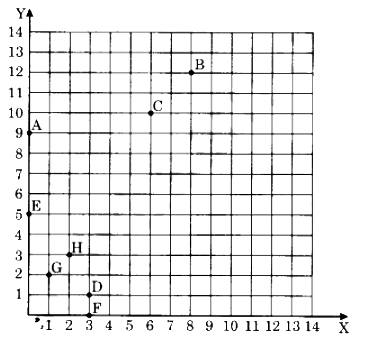 Ans: (i) D(3, 1)
(ii) E(0, 5)
(iii) F(3, 0)
(iv) G(1, 2)
(v) H(2, 3)
(vi) B(8, 12)
(vii) C(6, 10)
(viii) A(0, 9)
Q5: The given graph shows the flight of an aeroplanes.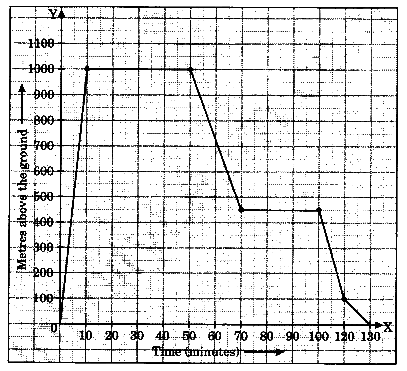 (i) What are the scales taken on x-axis and y-axis?
(ii) Upto what height the aeroplane rises?
(iii) What was the speed of the aeroplane while rising?
(iv) How long was the plane in level flight?
(v) How long did the whole flight take?
Ans:
(i) Scale on x-axis, 1 cm = 10 minutes
Scale ony-axis, 1 cm = 100 metres
(ii) The aeroplane rose upto 1000 metres.
(iii) The speed of the aeroplane while rising was 100 m per minutes.
(iv) The time taken by the aeroplane to be in level flight is 40 + 30 = 70 minutes
(v) Total flight time is 130 minutes.
|
81 videos|452 docs|31 tests
|


Class 8 Maths Chapter 13 Question Answers - Introduction to Graphs
,Previous Year Questions with Solutions
,Semester Notes
,MCQs
,Class 8 Maths Chapter 13 Question Answers - Introduction to Graphs
,mock tests for examination
,Important questions
,Sample Paper
,video lectures
,Free
,ppt
,Summary
,past year papers
,Objective type Questions
,Viva Questions
,practice quizzes
,Exam
,study material
,Extra Questions
,Class 8 Maths Chapter 13 Question Answers - Introduction to Graphs
,shortcuts and tricks
;


Short Question Answer: Introduction to Graphs Free PDF Download
Importance of Short Question Answer: Introduction to Graphs
Short Question Answer: Introduction to Graphs Notes
Short Question Answer: Introduction to Graphs Class 8 Questions
Study Short Question Answer: Introduction to Graphs on the App
|
© EduRev
|
Education Revolution
|


|


within 7 days!