Smart Charts Class 5 Notes Maths Chapter 14
| Table of contents |

|
| Smart Charts |

|
| Tally Marks |

|
| Tables |

|
| Pie Charts |

|
| Bar Charts |

|
| Family Tree |

|
Smart Charts
- Smart charts help us see numbers in a picture.
- They show how things are related, like how many students use different ways to go to school.
- We use tables, bar charts, line charts, pie charts, and pictures to show this information.
Tally Marks
- Tally Marks is a quick method for tracking numbers.
- They represent counts using sets of five lines.
- Each count is represented by a vertical line (|).
- After every fourth count, a diagonal line (/) is added across the preceding four vertical lines.
- Tally marks to aid in counting efficiently and are depicted as vertical and diagonal stroke
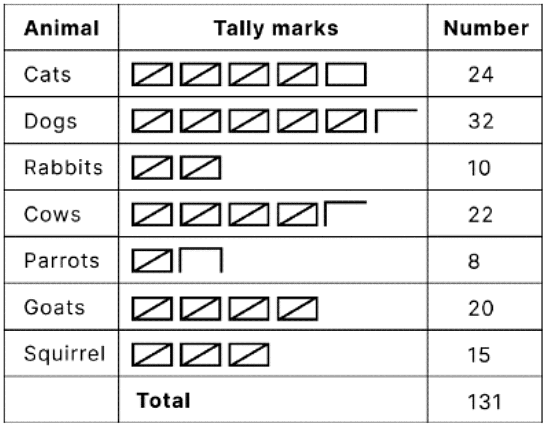 Tally Marks Example
Tables
- Tables organize information or data.
- They have rows and columns.
- Columns stand up and down, while rows go across.
- Tables help analyze data, do research, and share information.
 Table
Table - This table has 5 columns and 4 rows.
- It helps us see how many males and females are in each game.
Pie Charts
- A pie chart is a sort of chart that shows data in a circular graph.
- It is one of the most often used graphs for representing data by combining the qualities of circles to reflect real-world information.
- A pie chart is circular, with the pie representing the entire data and the slice out of the pie representing the parts of the data and recording it individually.
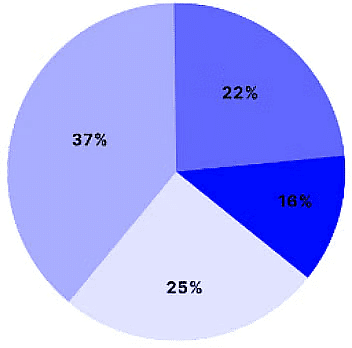
- Let us look at the following pie chart representing each slice's different percentages.
Pie Chart
- This pie chart represents the number of students in class with their favorite sports:
- Cricket: 37%
- Football: 25%
- Basketball: 22%
- Volleyball: 16%
Bar Charts
- A visual way to compare quantitative data using rectangles whose lengths are proportionate to the quantity of the data or items being compared; also known as a bar chart.
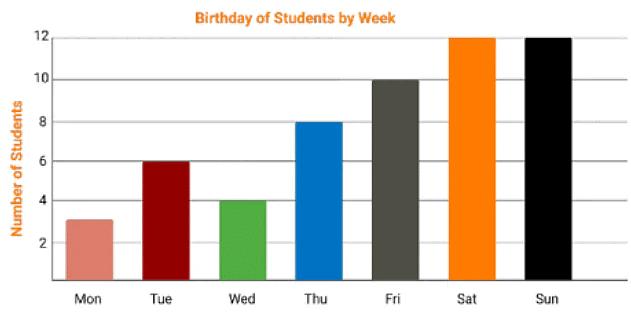
- The above example of a bar chart represents the number of students having weekly birthdays.
Example: (i) 3 students have their birthday on Monday.
(ii) 6 students have their birthday on Tuesday.
(iii) 4 students have their birthday on Wednesday.
(iv) 8 students have their birthday on Thursday.
(v) 10 students have their birthday on Friday.
(vi) 12 students have their birthday on Saturday.
(vii) 12 students have their birthday on Sunday.
Family Tree
- A family tree is a graphical or visual representation of our ancestors.
- A family tree not only helps us understand our history, but also helps us comprehend our relationships with other people who share shared ancestors.
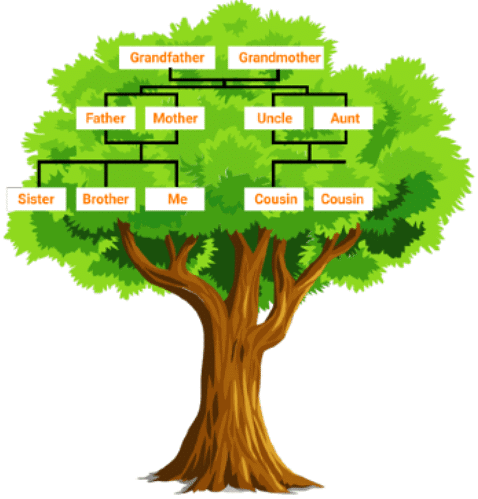 Family Tree Example
 - The above example of the Family Tree justifies the relationships shared by a family amongst themselves.
Solved Examples:
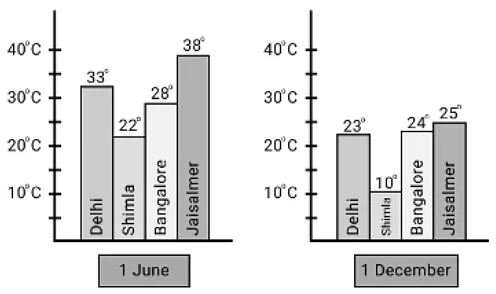 Temperature Graph
Find Out From the Bar Chart:
Q1: Which city is hottest on 1 June?
Sol: Jaisalmer is hottest on 1 June
Q2: Which city is coldest on 1 December?
Sol: Shimla is coldest on 1 December
Q3: Which city shows little change in temperature on the two days ----1 June and 1 December?Sol: Bangalore shows little change in temperature on the two days. The lowest change = 28 – 24 = 4 degrees Celcius.
Example 2: In the EVS period, the teacher asked the children whether they help their parents at home. There were different answers. Children named the work in which they help their parents the most. The teacher collected their answers and made a table.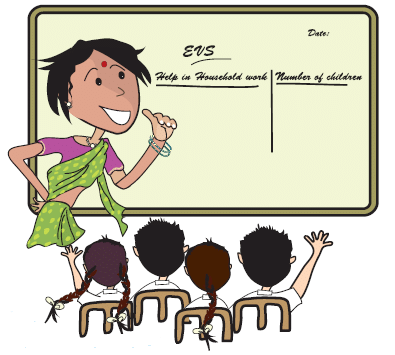
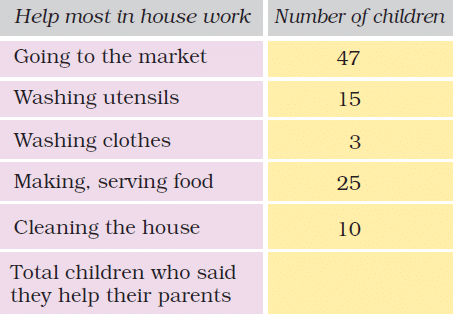
1) Look and find out:
Children who help in making or serving food are
(a) One-third of the total children
(b) Half of the total children
(c) One-fourth of the total children
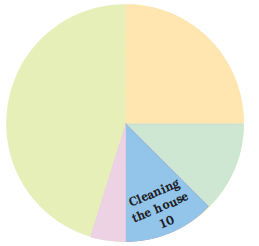 Sol: (c) One-fourth of the total children
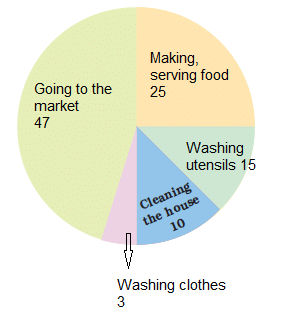
Example 3: Madhav went to a wedding along with his parents. He met many relatives there. But he didn’t know everyone. He met his mother’s grandfather but found that her grandmother was not alive. He also found that her mother (grandmother’s mother) is still alive and is more than a hundred years old.
Madhav got confused. He couldn’t imagine his mother’s grandmother’s mother! So, Madhav’s mother made a family tree for him, as shown below: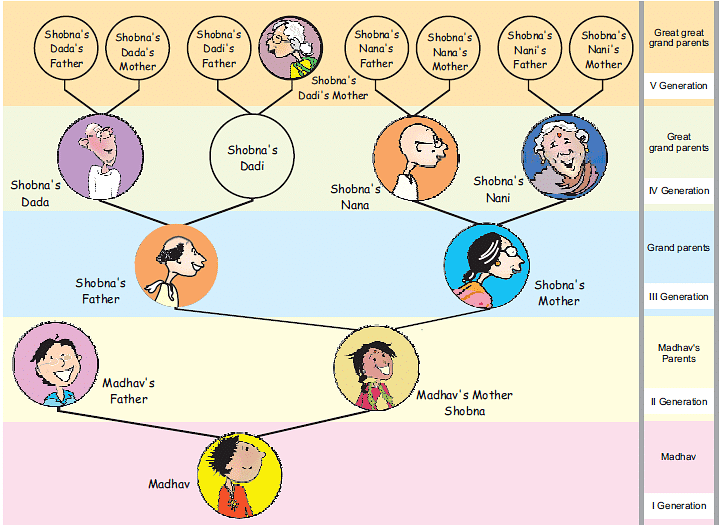
Madhav’s mother helped him understand her family with the help of this drawing. You can also find out about your older generations using such a family tree.
Answer the following questions:
Q1: How many grandparents in all does Shobna have?
Sol: Shobna has four grandparents.
Q2: How many great, great grandparents in all does Madhav have?
Sol: Madhav has eight great, great grandparents in all.
Q3: How many elders will be in the VII generation of his family?
Sol: 32 elders will be in the VII generation of his family.
VI generation: 8 × 2 = 16
VII generation: 16 × 2 = 32
Q4: If he takes his family tree forward, in which generation will he find 128 elders?
SoL: Number of members in VII generation of Madhav’s family = 32
Number of members in VIII generation of Madhav’s family = 32 × 2 = 64
Number of members in IX generation of Madhav’s family = 64 × 2 = 128
Thus, in the IX generation, the number of elders in Madhav’s family will be 128.
|
31 videos|192 docs|41 tests
|
FAQs on Smart Charts Class 5 Notes Maths Chapter 14
| 1. What are smart charts? |  |
| 2. How are tally marks used in data representation? |  |
| 3. What information can be displayed in tables? |  |
| 4. How are pie charts useful in data analysis? |  |
| 5. What are the advantages of using bar charts? |  |


