Steps For Graphics Interpretation Questions on the GMAT | Data Insights for GMAT PDF Download
Graphics Interpretation (GI) questions on the GMAT show pictures or charts with some information written beside them. After that, there are two sentences with missing parts. You need to choose the right words from a list to complete both sentences. Remember, you have to get both parts right to get points for the question.
Steps For Graphics Interpretation Questions:
1. Start With the Big Picture
- In a general way, categorize the presented graphic. (EX: “This is a graph showing the change in the price of textiles per yard over the course of five years.”)
- Do not just skip the graphic entirely and go straight to the two statements! This will significantly decrease your accuracy as you must spend the majority of your time focusing on understanding the graphic thoroughly in order to later “interpret” it.
- Make sure you read every tiny piece of writing on or near the data, including titles, the labels for the x and y-axes, column names, and even footnotes. Scroll down or left/right if necessary to make sure you’ve caught everything.
2. Pay Attention to Symbols
- Once you understand the big picture, take special care to note any units (mph, m/sec, cm2, etc.) on the graph, or any symbols provided.
- Are we dealing with seconds, minutes, or hours? Does one graph represent the month of June, while another graph represents the entire year?
- For example, if this Sample Graphics Interpretation question it’s interesting to note that virtually the entire question hinges on your recognition that the hourglass symbol represents 10 students, and on your ability to apply that to the given Venn diagram.
3. Locate Any Trend in The Data
- Quickly note the relationship between any given variables in the graph.
- For Venn diagrams, ask yourself where the least and greatest number of people lie. Do any variables have a direct or indirect correlation? Where does the data seem to spike or significantly decrease?
4. Identify The Keywords in The Sentences
- Even small words like “less than” or “equates to” can make a huge difference.
- What keywords are found in the statements that are ALSO found in the graphic? Move slowly through each statement.
5. Predict Before Looking at The Drop-Down
- Come up with your own answer choice before clicking on the options in the drop-down menu.
- If you do not find your answer as one of the presented options, you have likely made a simple mistake either in 1) your understanding of the way information is presented in the graphic, or 2) your understanding of the specific phrasing of the statement.
- Don’t worry if your predictions are off at first. Graphics Interpretation can be challenging!
6. Solving Graphics Interpretation Questions in GMAT
Each Graphics Interpretation question on the GMAT will include some text that contains two blanks. These blanks can be filled in by choosing options from a drop-down menu that make the text as accurate as possible.
Graphics Interpretation sample question
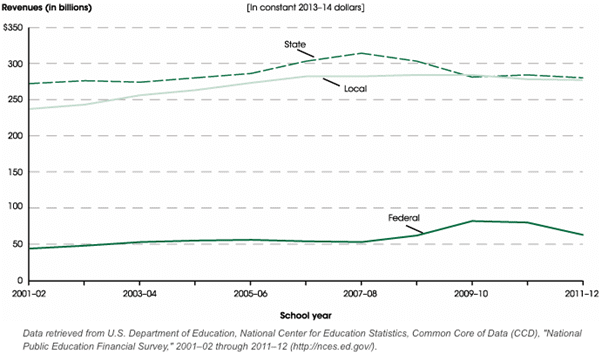
The graph shows revenues for public elementary and secondary schools by revenue source for the school years from 2001-02 to 2009-10.
From each drop-down menu, select the option that creates the most accurate statement based on the information provided.
Revenue from the state government was highest during the year.
During the 2001-02 school year, revenue from the federal government accounted for about % of total revenue.
Answer Options
The three options for the first drop-down menu are 2007-08, 2008-09 and 2009-10.
For the second drop-down menu, the options are 9, 43 and 48.
How to solve this Graphics Interpretation question
You can see easily from the graph that the highest revenue from state government came during the 2007-08 school year. Thus, you would choose this option from the drop-down menu.
In 2001-02 the federal government contributed about 50 million, and the state and local governments contributed around 510 million together. Thus, the total revenue was around 560 million. 50/560 —> 5/56 —> ~1/11 —> a little less than 10%. You would then click the drop-down menu and find 9 as the answer.
Note that this question involved a line graph. Some questions in the graphics interpretation section of integrated reasoning on the GMAT involve bar graphs, and some questions involve both line and bar graphs. There shouldn’t be any particular difficulties in interpreting bar graphs—the same principles that you use for line graphs apply.
Questions in Graphics Interpretation often ask you to calculate percentage change, so keep the following in mind:
Review of calculating percentage change
The formula for calculating percentage change is difference / original x 100.
For example, if the value of sales (in dollars) increases from 40m to 50m, by what percentage has sales increased?
Difference = 50 – 40 = 10
Percentage change = Difference / original x 100 =
10 / 40 x 100 = ¼ x 100 = 25%
So, sales increased by 25%.
|
24 videos|28 docs|21 tests
|
FAQs on Steps For Graphics Interpretation Questions on the GMAT - Data Insights for GMAT
| 1. What is the purpose of starting with the big picture when solving graphics interpretation questions? |  |
| 2. Why is it important to pay attention to symbols in graphics interpretation questions? |  |
| 3. How can locating any trend in the data help in solving graphics interpretation questions? |  |
| 4. Why is it necessary to identify the keywords in the sentences when solving graphics interpretation questions? |  |
| 5. What is the benefit of predicting before looking at the drop-down in graphics interpretation questions? |  |


