Tips and Tricks: Venn Diagrams | Logical Reasoning (LR) and Data Interpretation (DI) - CAT PDF Download
| Table of contents |
|
| Key Concepts: Basic Venn Diagram Rules |
|
| Common Question Types |
|
| Tips and Tricks for Solving Venn Diagram Questions |
|
| Common Mistakes and How to Avoid Them |
|

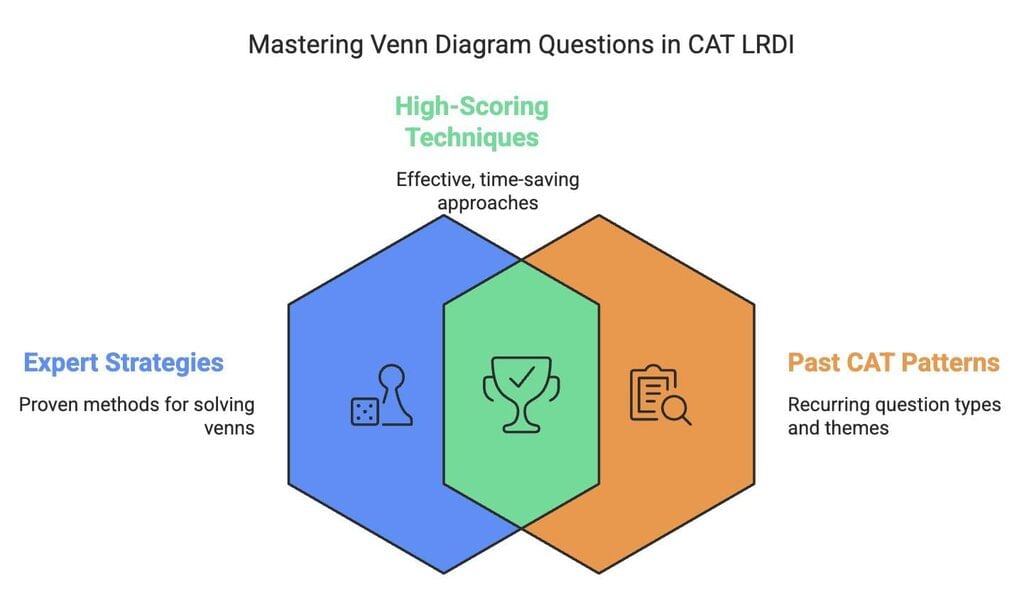
Venn Diagram questions in the CAT LRDI section test your ability to visualise relationships between sets, calculate overlaps, and apply logical reasoning. These questions often involve maximising/minimising values, finding missing numbers, or determining relationships between groups. Below are specific, actionable tips and tricks derived from expert strategies, past CAT patterns, and high-scoring techniques.
Key Concepts: Basic Venn Diagram Rules
- Union (∪): Total elements in either set.
- Intersection (∩): Common elements between sets.
- Complement: Elements not in a particular set.
- Formula for Two Sets :
n(A∪B)=n(A)+n(B)−n(A∩B) - Formula for Three Sets :
n(A∪B∪C)=n(A)+n(B)+n(C)−n(A∩B)−n(B∩C)−n(C∩A)+n(A∩B∩C)
Common Question Types
- Maximizing/Minimizing Overlaps:
Example: What is the maximum number of people who like both coffee and tea? - Finding Missing Values:
Example: If 30% of people like apples and bananas, how many like only apples? - Three-Set Problems:
Example: People liking A, B, and C; find those liking exactly two or all three. - Percentage-Based Questions:
Example: 60% passed Math, 50% passed Science; find the percentage who passed both.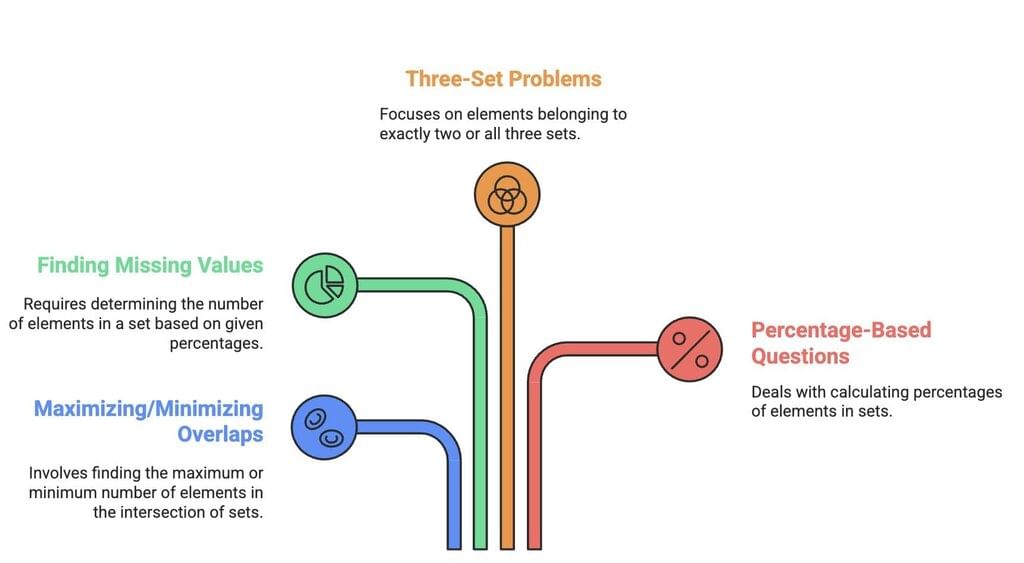
Tips and Tricks for Solving Venn Diagram Questions
1. Start with the Center (for Three-Set Diagrams)
- Why: The center (intersection of all three sets) is the most constrained region because it’s part of all overlapping areas . Solving it first prevents contradictions in outer overlaps.
How:
- Assign variables to unknown regions.
- Begin with
n(A ∩ B ∩ C), then fill outer overlaps. - Example: If 10 people like all three subjects, start by placing 10 in the center.
2. Use Variables for Flexibility
- Why: Variables help manage unknowns systematically, especially when direct values aren’t provided.
How:
- Assign variables like x, y, z to unknown regions.
- Use equations to solve for variables.
- Example :
Let x = a number of people liking only A and B.
Then, use total values to form equations.
3. Maximise/Minimise Overlaps Strategically
Why: These questions test your ability to visualise extremes (e.g., maximising overlaps to find the upper limit).
For Maximum Overlap :
- Distribute elements to overlap as much as possible.
- Example: If 70% like A and 60% like B, the maximum overlap = 60%.
For Minimum Overlap :
- Distribute elements to minimise overlaps.
- Use the formula:
Minimum Overlap = n(A) + n(B) - Total.
4. Understand "Only" Vs. "At Least"
Why: Misinterpreting these terms leads to overcounting or undercounting overlaps.
- "Only A": Elements in A but not in B or C.
- "At least A": Includes overlaps with other sets.
- Pro Tip: Always clarify whether the question refers to exclusive or inclusive groups.
5. Convert Percentages to Absolute Values
- Why: Working with whole numbers reduces errors in overlap calculations.
How:
- Assume a total (e.g., 100 people) for percentage-based problems.
- Convert percentages to actual numbers.
Example:
If 60% passed Math and 50% passed Science, assume 100 students: - 60 passed Math, 50 passed Science.
- Use formulas to calculate overlaps (e.g., 60 + 50 – 100 = 10% passed both).
6. Use the "All or None" Rule for Constraints
- Why: Some questions specify conditions like "All who like A also like B."
How :
- If "All A are B," then A ∩ B = A (no one in A is outside B).
- If "No A are B," then A ∩ B = 0.
Example:
If "All vegetarians are health-conscious," the vegetarian circle lies entirely within the health-conscious circle.
7. Leverage Symmetry in Three-Set Problems
- Why: Equal overlaps simplify calculations when no specific data is given.
How :
- Assume equal distribution of overlaps unless told otherwise.
- Example: If no info is given about overlaps between A, B, and C, assume A ∩ B = B ∩ C = C ∩ A.
- Adjust later if constraints contradict this assumption.
8. Watch for "None of the Above" Cases
- Why: Questions often include people who don’t belong to any set.
- Subtract known values from the total to find "none."
Example:
Total = 100, sum of all regions = 80 → 20 like none.
EduRev Tip : Always verify if the question specifies that "everyone belongs to at least one set."
9. Apply the Principle of Inclusion-Exclusion
- Why : Avoid double-counting overlaps.
How:
- For two sets: Subtract A ∩ B once.
Example:If A = 50, B = 40, A ∩ B = 20, then A ∪ B = 50 + 40 – 20 = 70. - For three sets: Add back A ∩ B ∩ C after subtracting pairwise overlaps.
Example: If A ∩ B ∩ C = 10, subtract pairwise overlaps but add 10 back to avoid over-subtraction.
10. Eliminate Red Herrings in Multiple-Choice Questions
- Why: Some options violate basic set rules (e.g., overlaps > individual sets).
How:
Reject options where overlaps exceed individual set sizes.
Example: If A = 30 and A ∩ B = 40, the option is invalid (overlap can’t exceed A).
Pro Tip: Plug answer choices into your equations to validate quickly.
Common Mistakes and How to Avoid Them
|
87 videos|179 docs|99 tests
|
FAQs on Tips and Tricks: Venn Diagrams - Logical Reasoning (LR) and Data Interpretation (DI) - CAT
| 1. What are the basic components of a Venn diagram? |  |
| 2. How can I effectively solve Venn diagram questions in exams like the CAT? | |
| 3. What are some common mistakes when interpreting Venn diagrams? | |
| 4. Can you provide tips for managing time when answering Venn diagram questions during the CAT? | |
| 5. How can I practice Venn diagram questions for the CAT exam? | |


video lectures
,mock tests for examination
,Previous Year Questions with Solutions
,Tips and Tricks: Venn Diagrams | Logical Reasoning (LR) and Data Interpretation (DI) - CAT
,Objective type Questions
,shortcuts and tricks
,Tips and Tricks: Venn Diagrams | Logical Reasoning (LR) and Data Interpretation (DI) - CAT
,practice quizzes
,study material
,Extra Questions
,Summary
,past year papers
,Exam
,Tips and Tricks: Venn Diagrams | Logical Reasoning (LR) and Data Interpretation (DI) - CAT
,ppt
,Viva Questions
,Free
,Semester Notes
,Important questions
,Sample Paper
,MCQs
;


Tips and Tricks: Venn Diagrams Free PDF Download
Importance of Tips and Tricks: Venn Diagrams
Tips and Tricks: Venn Diagrams Notes
Tips and Tricks: Venn Diagrams CAT Questions
Study Tips and Tricks: Venn Diagrams on the App
|
© EduRev
|
Education Revolution
|


|


