Transition Diagram | Compiler Design - Computer Science Engineering (CSE) PDF Download

A transition diagram or state transition diagram is a directed graph which can be constructed as follows:
- There is a node for each state in Q, which is represented by the circle.
- There is a directed edge from node q to node p labelled a if δ(q, a) = p.
- In the start state, there is an arrow with no source.
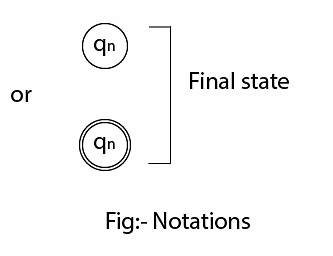
- Accepting states or final states are indicated by a double circle.
Some notations that are used in the transition diagram: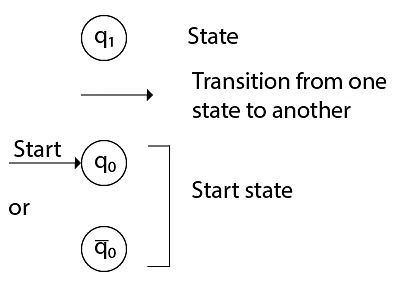
 The following is a description of how a DFA operates:
1. In a DFA, the input to the automaton can be any string. Place a pointer at the start state q, read the input string w from left to right, and move the pointer according to the transition function, δ. We can read one symbol at a time. If the next symbol of string w is a and the pointer is on state p, move the pointer to δ(p, a). When the end of the input string w is encountered, the pointer will be on some state r.
2. The string w is said to be accepted by the DFA if r ∈ F, which means the input string w is processed successfully and the automaton reached its final state. The string is said to be rejected by the DFA if r ∉ F.
Example: DFA with ∑ = {0, 1} accepts all strings starting with 1.
Solution: 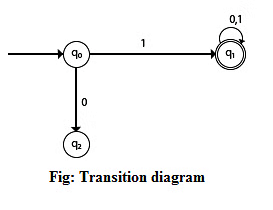
The finite automation can be represented using a transition graph. In the above diagram, the machine initially is in start state q0; upon receiving input 1, the machine changes its state to q1. From q0, upon receiving 0, the machine changes its state to q2, which is the dead state. From q1, upon receiving input 0 or 1, the machine remains in state q1, which is the final state. The possible input strings that can be generated are 10, 11, 110, 101, 111, etc., which means all strings start with 1.
|
26 videos|90 docs|30 tests
|
FAQs on Transition Diagram - Compiler Design - Computer Science Engineering (CSE)
| 1. What is a transition diagram and how is it used in computer science? |  |
| 2. What are the components of a transition diagram? | |
| 3. How do you create a transition diagram for a given system? | |
| 4. What is the difference between a transition diagram and a flowchart? | |
| 5. Can transition diagrams be used for real-time systems? | |


Exam
,Important questions
,study material
,past year papers
,ppt
,practice quizzes
,Previous Year Questions with Solutions
,Extra Questions
,Transition Diagram | Compiler Design - Computer Science Engineering (CSE)
,Transition Diagram | Compiler Design - Computer Science Engineering (CSE)
,Free
,video lectures
,Transition Diagram | Compiler Design - Computer Science Engineering (CSE)
,Summary
,Sample Paper
,Viva Questions
,shortcuts and tricks
,Semester Notes
,Objective type Questions
,mock tests for examination
,MCQs
;


Transition Diagram Free PDF Download
Importance of Transition Diagram
Transition Diagram Notes
Transition Diagram Computer Science Engineering (CSE) Questions
Study Transition Diagram on the App
|
© EduRev
|
Education Revolution
|


|


