Unit Test (Solutions): Data Through Pictures | Mathematics (Maths Mela) Class 5 - New NCERT PDF Download

Time: 1 hour M.M. 20
Attempt all questions.
- Each question carries 5 marks
Q1: Tim recorded the number of donuts sold over five days. (5 marks)
Read the chart and answer the questions.
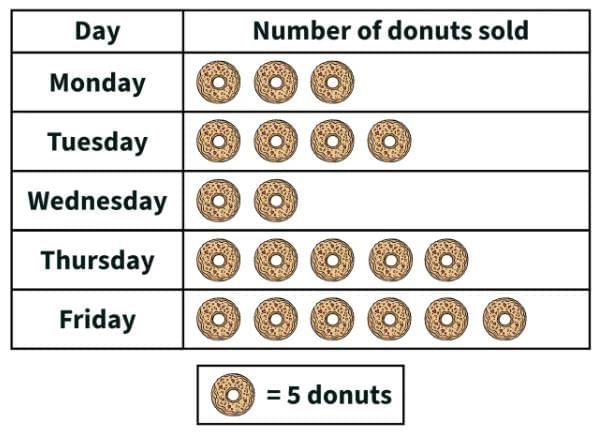
- How many donuts did he sell on Thursday?
- Which day did he sell the least donuts?
- Which day did he sell the most donuts?
- Which day did he sell 20 donuts?
- Which day did he sell 15 donuts?
Solution:
- Donuts sold on Thursday = 5 x 5 = 25 donuts
- least donuts were sold on Wednesday
- most donuts were sold on Friday
- Tuesday
- Monday
Q2: The pictograph shows how many snowballs each child made. Use the pictograph to answer the given questions. (5 marks)
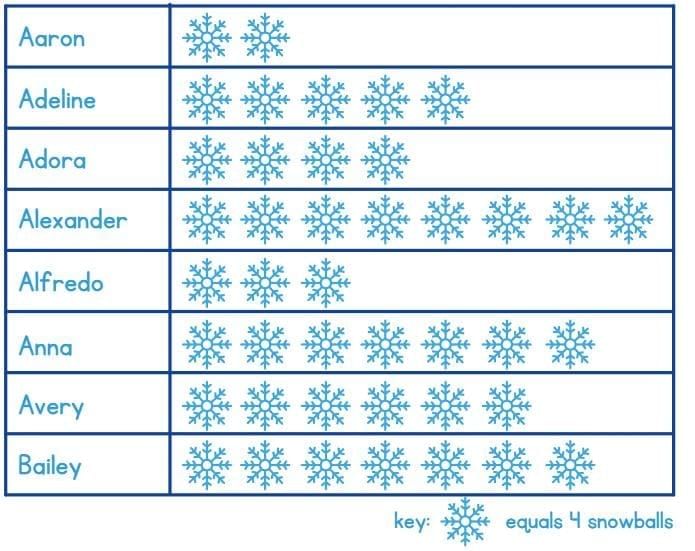
(i) How many snowballs did Alfredo make?
(ii) How many snowballs did Aaron make?
(iii) Name two people who made the same number of snowballs.
(iv) How many more snowballs did Bailey make than Adeline?
(v) How many more snowballs did Alexander make than Adora?
Ans:
(i) There are 3 pictures in front of Alfredo. 1 snowflake represents 4 snowballs made.
So, Alfredo made 3x4 = 12 snowballs.
(ii) There are 2 pictures in front of Aaron. 1 snowflake represents 4 snowballs made.
So, Aaron made 2x4 = 8 snowballs.
(iii) Anna and Bailey made the same number of snowballs.
We can simply look at the number of snowflakes in front of each name and see that Anna and Bailey have same number of snowflakes drawn in front of their names.
There are 7 snowflakes which means 7x4 = 28. So, Anna and Bailey, both of them, made 28 snowballs each.
(iv) Bailey made 28 snowballs where as Adeline made 20 snowballs (5x4 = 20)
28- 20 = 8
Bailey made 8 more snowballs than Adeline.
(v) Alexander : 8 x 4 = 32 snowballs
Adora: 4 x 4 = 16
32- 16 = 16
Alexander made 16 more snowballs than Adora.
Q3: Following is the pictograph of class VI students. Here 1 (5 marks) = 10 boys and 1
  = 10 girls. Looking at the pictograph below, answer the following questions.
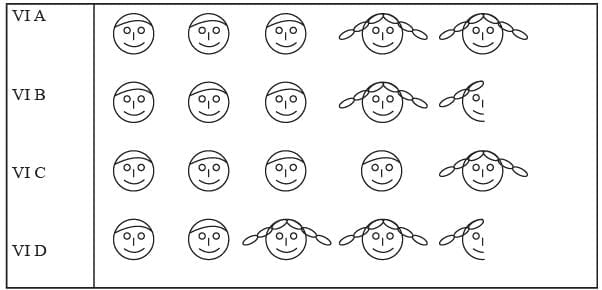
(i) How many students are there in VI A, VI B, VI C and VI D sections each? __________
(ii) Which section has maximum number of boys? __________
(iii) Which section has maximum number of girls? __________
(iv) What is the total strength of class VI? __________
Ans.
(i) VI A = 50 students
VI B = 45 students
VI C = 50 students
VI D = 45 students
(ii) Section C has the maximum number of boys.
(iii) Section D has the maximum number of girls.
(iv) Total strength of class VI is 50 + 45 + 50 + 45 = 190 Students
Q4: The number of students present in class VI during a particular week is given below. It is represented by a pictograph where 1  = 6 students. (5 marks)
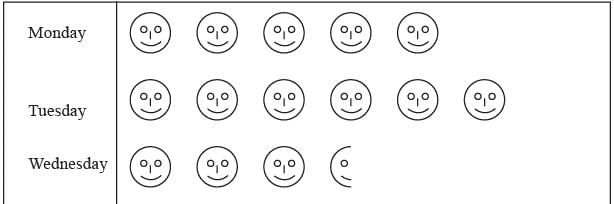
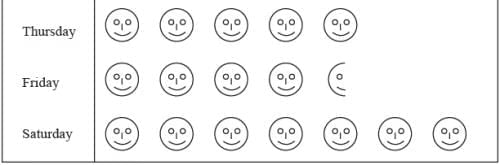
(i) On which day maximum students were present? __________
(ii) On which day minimum students were present? __________
(iii) How many students were present on wednesday and Thursday each? __________
Ans:
(i) On Saturday maximum students were present.
(ii) On Wednesday minimum students were present.
(iii) 21 students were present on Wednesday and 30 students were present on Thursday.
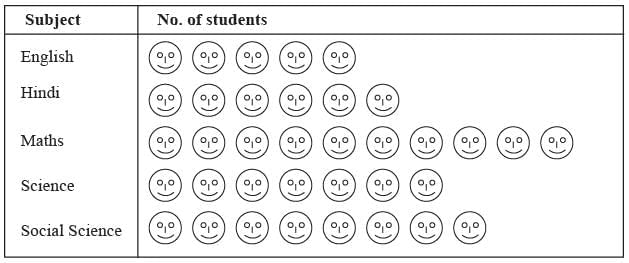
Q5: A survey showed the preference of different subjects by students of class VI (5 marks)
| Subject | No. of Students |
| English | 25 |
| Hindi | 30 |
| Maths | 50 |
| Science | 35 |
| Social Science | 40 |
Draw a pictograph to illustrate the above data taking a scale of 1 students.
Ans:
 students.
Q6: The following pictograph shows the number of pears in 6 bags (5 marks)
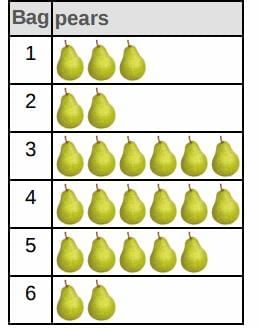 Find the following.
(a) Bag with the maximum number of pears.
(b) Bag with the minimum number of pears.
(c) Total number of pears in all the bags.
(d) Total number of pears in all the bags 1 & 2.
(e) How many more pears does bag 4 have than bag 2?
Ans:
(a) It is clear from the given pictograph that there are 6 pears in the bags 3 and 4. This is the maximum number of pears in all the bags. Therefore, we can say that the bags 3,4 have the maximum number of pears.
(b) It is clear from the given pictograph that there are 2 pears in the bags 2 and 6. This is the minimum number of pears in all the bags. Therefore, we can say that the bags 2,6 have the minimum number of pears.
(c) Total number of pears in all the bags = Sum of the pears in all the 6 bags = 3 + 2 + 6 + 6 + 5 + 2 = 24 pears
(d) Bag 1 + Bag 2 = 3 + 2 = 5 pears
(e) Bag 4 - Bag 2 = 6 - 2 = 4 pears
|
35 videos|276 docs|7 tests
|
FAQs on Unit Test (Solutions): Data Through Pictures - Mathematics (Maths Mela) Class 5 - New NCERT
| 1. What is the importance of data representation through pictures? |  |
| 2. What types of visual data representations are commonly used? | |
| 3. How can students use visual data representation in their studies? | |
| 4. What are some common mistakes to avoid when creating visual data representations? | |
| 5. What role does data interpretation play in understanding visual representations? | |


video lectures
,Previous Year Questions with Solutions
,Exam
,Objective type Questions
,Viva Questions
,study material
,past year papers
,shortcuts and tricks
,mock tests for examination
,Extra Questions
,Unit Test (Solutions): Data Through Pictures | Mathematics (Maths Mela) Class 5 - New NCERT
,practice quizzes
,Important questions
,MCQs
,Unit Test (Solutions): Data Through Pictures | Mathematics (Maths Mela) Class 5 - New NCERT
,Sample Paper
,ppt
,Unit Test (Solutions): Data Through Pictures | Mathematics (Maths Mela) Class 5 - New NCERT
,Semester Notes
,Summary
,Free
;


Unit Test (Solutions): Data Through Pictures Free PDF Download
Importance of Unit Test (Solutions): Data Through Pictures
Unit Test (Solutions): Data Through Pictures Notes
Unit Test (Solutions): Data Through Pictures Class 5 Questions
Study Unit Test (Solutions): Data Through Pictures on the App
|
© EduRev
|
Education Revolution
|


|


