Unit Test (Solutions): Statistics | Mathematics (Maths) Class 9 PDF Download

Time: 1 hour
M.M. 30
Attempt all questions.
Question numbers 1 to 5 carry 1 mark each.
Question numbers 6 to 8 carry 2 marks each.
Question numbers 9 to 11 carry 3 marks each.
Question numbers 12 & 13 carry 5 marks each.
Q1. Name a graphical representation where frequencies are represented by line segments. (1 Mark)
Ans: Frequency Polygon
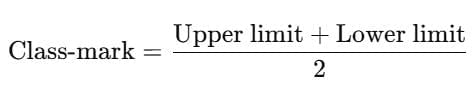
Q2. What is the formula to find the class mark of a class interval? (1 Mark)
Ans:
Q3. If the class limits are 30–40, what is the class size? (1 Mark)
Ans: Class Size = 40 − 30 = 10
Q4. Why is a kink or break shown in a histogram sometimes? (1 Mark)
Ans: A kink is shown when the data does not start from zero on the horizontal axis.
Q5. The class mark of the class 90-120 is (1 Mark)
(a) 90
(b) 105
(c) 115
(d) 120
Ans: (b)
Class mark is the mean of the upper and lower limit of the class interval = (90 + 120)/2 = 105
Q6. The blood groups of 30 students are recorded as follows:
A, B, O, A, AB, O, A, O, B, A, O, B, A, AB, B, A, AB, B,
A, A, O, A, AB, B, A, O, B, A, B, A
Prepare a frequency distribution table for the data. (2 Marks)
Ans:
Number of students having blood group AB = 3
Total students = 30
P = (3/30) = (1/10)
Q7. The points scored by a basketball team in a series of matches are as follows: (2 Marks)
17, 7, 10, 25, 5, 10, 18, 10 and 24. Find the range.
Ans: Here, maximum points = 25 and
minimum points = 5
Range = Maximum value – Minimum value
= 25 – 5 = 20
Q8. The width of each of the five continuous classes in a frequency distribution is 5, and the lower class limit of the lowest class is 10. The upper-class limit of the highest class is
(a) 15
(b) 25
(c) 35
(d) 40
Ans: (c)
Lower limit of lowest class = 10
Class width = 5
Number of classes = 5
Upper limit of highest class = 10 + (5 × 5) = 35
Q9. The points scored by a basket ball team in a series of matches are as follows:
17, 2, 7, 27, 25, 5, 14, 18, 10, 24, 48, 10, 8, 7, 10, 28
Find the median and mode for the data. (3 Marks)
Ans: Arrange in ascending order = 2, 5, 7, 7, 8, 10, 10, 10, 14, 17, 18, 24, 25, 27, 28, 48
Total 16 elements
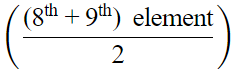
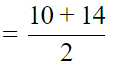
So median =
= 12
mode = 10 (3 times repeating)
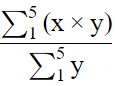
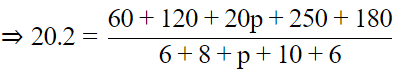
Q10. If the mean of the following data is 20.2, find the value of p: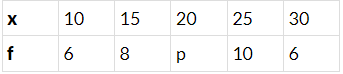 (3 Marks)
Ans: Mean =
⇒ (30+p) × 20.2 = 20p + 610
⇒ 0.2p = 4
⇒ p = 20
Q11. The number of family members in 10 flats of society is
2, 4, 3, 3, 1, 0, 2, 4, 1, 5.
Find the mean number of family members per flat. (3 Marks)
Ans: Number of family members in 10 flats -2, 4, 3, 3, 1, 0, 2, 4, 1, 5.
So, we get,
Mean = sum of observation/ total no of observations
Mean = (2 + 4+ 3 + 3 + 1 + 0 + 2 + 4 + 1 + 5) / 10
Mean = 25/10 = 2.5
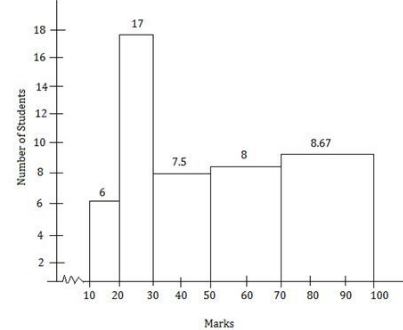
Q12. The marks obtained (out of 100) by a class of 80 students are given below :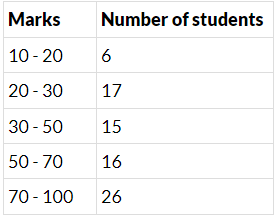
Construct a histogram to represent the data above.
(5 Marks)
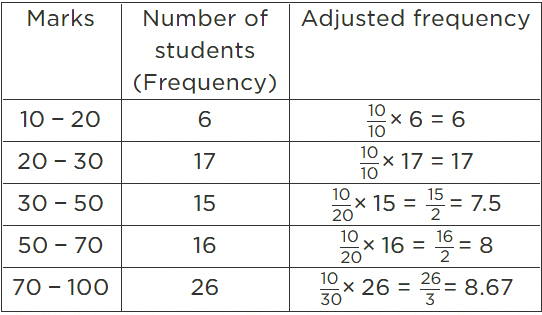
Ans: In the given frequency distribution, class sizes are different. So, we calculate the adjusted frequency for each class.
Here, minimum size = 20 - 10 = 10
We use the formula,
Adjusted frequency of a class = (Minimum Class size/Class size of this class) x (Its frequency)
The modified table for frequency distribution is given below.
Along the horizontal axis, we represent the class intervals of marks on some suitable scale.
The corresponding frequencies of the number of students are represented along the Y-axis on a suitable scale. The given intervals start with 10 - 20. It means that there is some break (≈) indicated near the origin to signify the graph is drawn with a scale beginning at 10.
Now, we draw rectangles with class intervals as the bases and the corresponding adjusted frequencies as heights.
A histogram of the given distribution is given below.
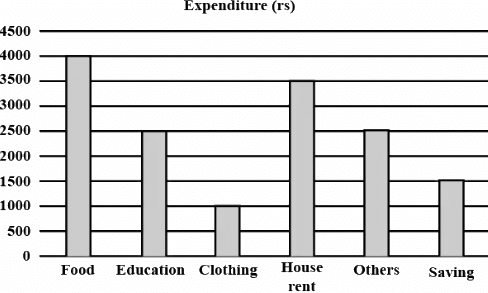
Q13. The expenditure of a family on different heads in a month is given below: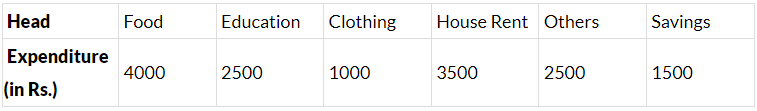
Draw a bar graph to represent the data above. (5 Marks)
Ans: To represent the above data by a bar graph, we first draw a horizontal and a vertical line. Since six values of the numerical data are given. So, we mark six points on the horizontal line at equal distance and erect rectangle of the same width at these points. The heights of the rectangle are proportional to the numerical values of the data as shown in the figure given below.
|
40 videos|470 docs|56 tests
|
FAQs on Unit Test (Solutions): Statistics - Mathematics (Maths) Class 9
| 1. What are the basic concepts of statistics that a Class 9 student should know? |  |
| 2. How do you calculate the mean, median, and mode from a given data set? | |
| 3. What are the different types of data and how are they classified? | |
| 4. What is the importance of graphs in statistics? | |
| 5. How can statistics be applied in real-life situations? | |


practice quizzes
,shortcuts and tricks
,Exam
,Unit Test (Solutions): Statistics | Mathematics (Maths) Class 9
,study material
,video lectures
,past year papers
,Previous Year Questions with Solutions
,mock tests for examination
,Semester Notes
,Sample Paper
,ppt
,Important questions
,Extra Questions
,MCQs
,Summary
,Viva Questions
,Unit Test (Solutions): Statistics | Mathematics (Maths) Class 9
,Free
,Unit Test (Solutions): Statistics | Mathematics (Maths) Class 9
,Objective type Questions
;


Unit Test (Solutions): Statistics Free PDF Download
Importance of Unit Test (Solutions): Statistics
Unit Test (Solutions): Statistics Notes
Unit Test (Solutions): Statistics Class 9 Questions
Study Unit Test (Solutions): Statistics on the App
|
© EduRev
|
Education Revolution
|


|


