Unit Test (Solutions): Statistics | Mathematics (Maths) Class 10 PDF Download

Time: 1 hour
M.M. 30
Attempt all questions.
- Question numbers 1 to 5 carry 1 mark each.
- Question numbers 6 to 8 carry 2 marks each.
- Question numbers 9 to 11 carry 3 marks each.
- Question number 12 & 13 carry 5 marks each.
Q1: If the mean of first n natural numbers is 3n/5, then the value of n is: (1 Mark)
(a) 3
(b) 4
(c) 5
(d) 6
Ans: (c)
Sum of natural numbers = n(n + 1)/2
Given, mean = 3n/5
Mean = sum of natural numbers/n
3n/5 = n(n + 1)/2n
3n/5 = (n + 1)/2
6n = 5n + 5
n = 5
Q2: The class interval of a given observation is 10 to 15, then the class mark for this interval will be: (1 Mark)
(a) 11.5
(b) 12.5
(c) 12
(d) 14
Ans: (b)
Class mark = (Upper limit + Lower limit)/2
= (15 + 10)/2
= 25/2
= 12.5
Q3: If the sum of frequencies is 24, then the value of x in the observation: x, 5,6,1,2, will be: (1 Mark)
(a) 4
(b) 6
(c) 8
(d) 10
Ans: (d)
Given,
∑fi = 24
∑fi = x + 5 + 6 + 1 + 2 = 14 + x
24 = 14 + x
x = 24 – 14 = 10
Q4: Find the class marks of classes 10-25 and 35-55. (1 Mark)
(a) 17.5, 20
(b) 18. 40
(c) 17.5, 45
(d) 17.5, 45
Ans: (d)
Class mark of 10-25 = 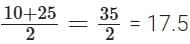
Class mark of 35-55 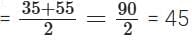
Q5: The method used to find the mean of a given data is(are): (1 Mark)
(a) direct method
(b) assumed mean method
(c) step deviation method
(d) all the above
Ans: (d)
The mean for a given data can be calculated using either of the following methods:
i) Direct method
ii) Assumed mean method
iii) Step deviation method
Q6: If the mode of the following data is 7, then find the value of k. (2 Marks)
2, 4, 6, 7, 5, 6, 10, 6, 7, 2k + 1, 9, 7, 13
Ans: There are two entries which occur 3 times each which are 6 and 7.
For 7 to be mode
2k + 1 = 7
k = 6/2 = 3
Q7: The mean of 6 numbers is 16 with the removal of a number the mean of remaining numbers is 17. Find the removed number. (2 Marks)
Ans: Let xd be the sixth number to be remove and x1 x2, …,x5 be remaining 5 numbers. 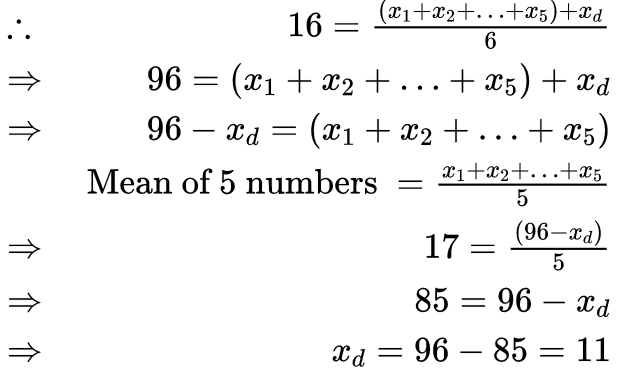
Q8: The mean of following frequency distribution is 70. Find the missing frequency x. (2 Marks)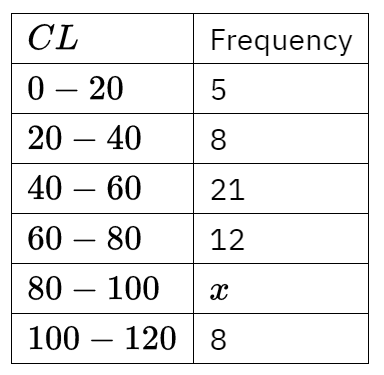
Ans: 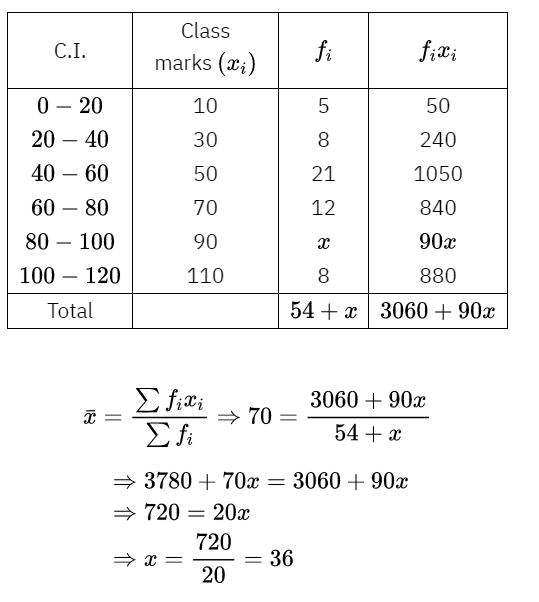
Q9: Find the mode of the following distribution of marks obtained by the students in an examination: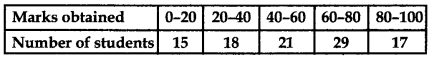 Given the mean of the above distribution is 53, using emperical relationship estimate the value of its median. (3 Marks)
Ans: Modal class is 60-80 (Class corresponding to maximum frequency)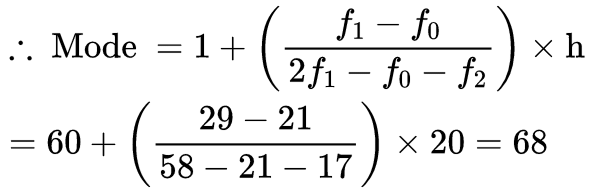 So, the mode marks is 68.
Empirical relationship between the three measures of central tendencies is:
3 Median = Mode + 2 mean
3 Median = 68 + 2 × 53
Median = 58 marks
Q10: Find the missing frequecny (x) of the following data if its mode is ₹240. (3 Marks)
Ans: Here mode is given to be ₹ 240, which lies between 200 and 300. Therefore, modal class is 200 – 300
We have l = 200, f1 = 270, f0 = 230, f2 = x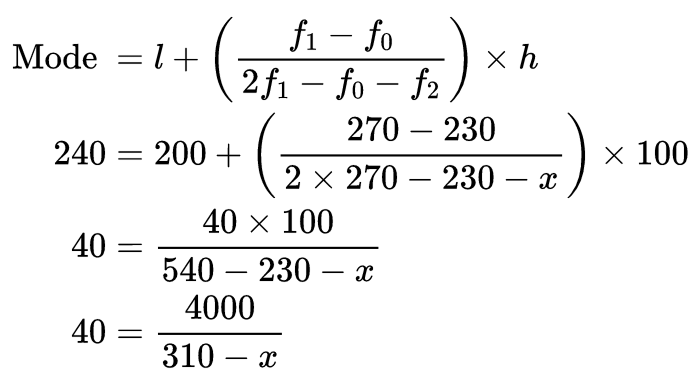 12400 – 40x = 4000
40x = 12400 – 4000
40x = 8400
x = 210
Q11: Consider the following distribution of daily wages of 50 workers of a factory. (3 Marks) Find the mean daily wages of the workers of the factory by using an appropriate method.
Ans: Find the midpoint of the given interval using the formula.
Midpoint (xi) = (upper limit + lower limit)/2
In this case, the value of mid-point (xi) is very large, so let us assume the mean value, a = 550.
Class interval (h) = 20
So, ui = (xi – a)/h
ui = (xi – 550)/20
Substitute and find the values as follows: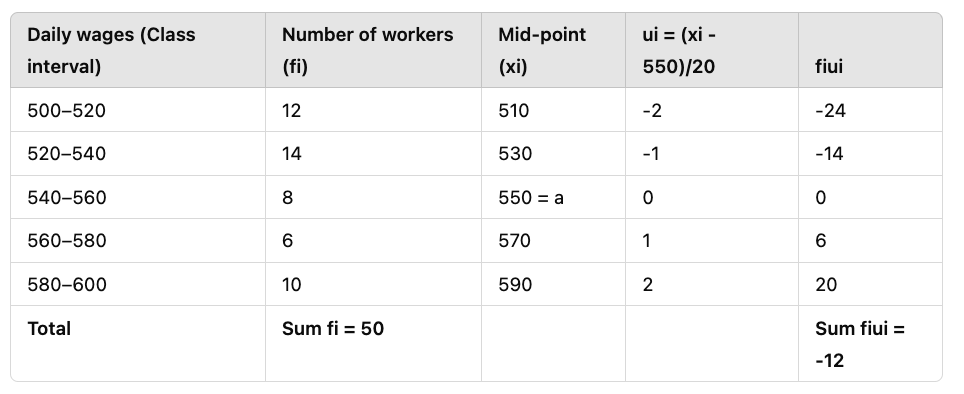 So, the formula to find out the mean is:
 Thus, mean daily wage of the workers = Rs. 545.20
Q12: The mean of the following frequency distribution is 62.8 and the sum of all frequencies is 50. Compute the missing frequencies f1 and f2. (3 Marks)
Ans: 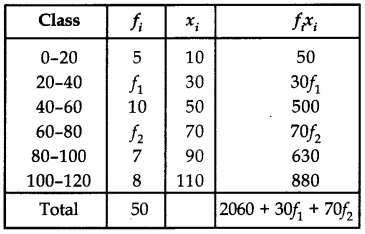
Now 50 = 5 + f1 + 10 + f2 + 7 + 8
⇒ 50 = 30 + f1 + f2
⇒ f1 + f2 = 20 ……….(i)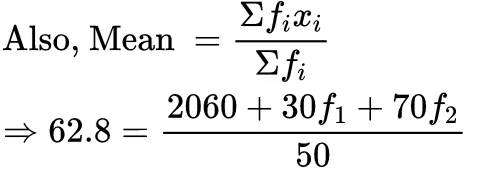
3140 = 2060 + 30f1 + 70f2
3f1 + 7f2 = 108
Solving (i) and (ii), we get
f1 = 8 and f2 = 12
Q13: Find the mean, mode and median of the following data: 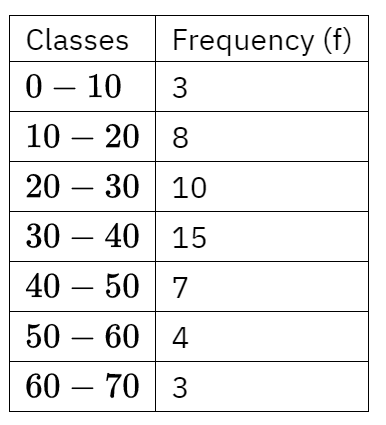
Ans: We prepare the table which serves all three purposes of getting mean, median and mode as given below: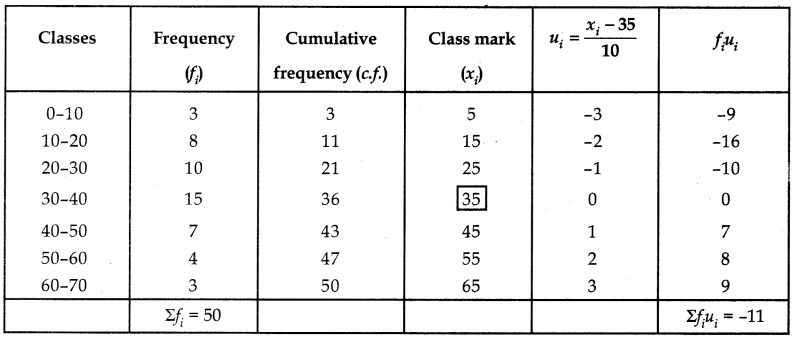 (i) Mean: Let assumed mean (A) be 35.
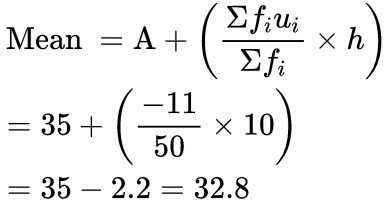
(ii) Mode: As maximum frequency is 15.
∴ Mode classes is 30-40.
Thus f1 = 15, f0 = 10, f2 = 7 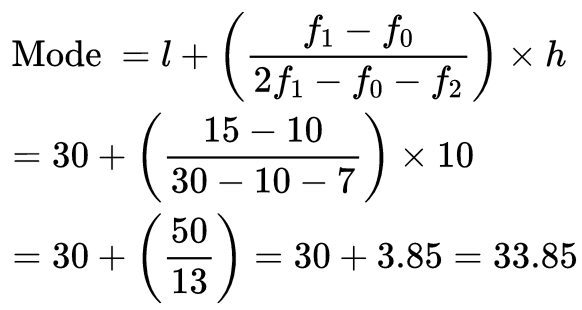
(iii) Median: Here N = 50 ⇒ N/2 = 25
The cumulative frequency just greater than 25 is 36 and the corresponding class is 30-40.
∴ Median class = 30-40, l = 30, cf = 21, f = 15 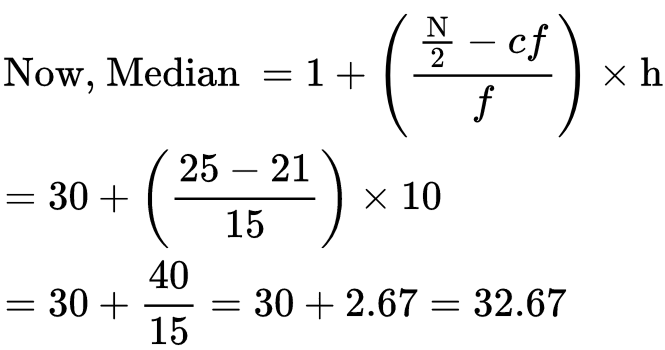
|
127 videos|584 docs|79 tests
|
FAQs on Unit Test (Solutions): Statistics - Mathematics (Maths) Class 10
| 1. What are some popular statistics hobbies that can improve my analytical skills? |  |
| 2. How can I start learning statistics as a hobby without a formal background? | |
| 3. What tools or software should I use for my statistics hobby? | |
| 4. Can engaging in statistics hobbies lead to career opportunities? | |
| 5. How can I find communities or groups that share my interest in statistics? | |


past year papers
,Unit Test (Solutions): Statistics | Mathematics (Maths) Class 10
,Unit Test (Solutions): Statistics | Mathematics (Maths) Class 10
,Extra Questions
,shortcuts and tricks
,study material
,MCQs
,Objective type Questions
,Summary
,Previous Year Questions with Solutions
,video lectures
,Exam
,Viva Questions
,Important questions
,mock tests for examination
,Unit Test (Solutions): Statistics | Mathematics (Maths) Class 10
,Free
,Semester Notes
,practice quizzes
,Sample Paper
,ppt
,


Unit Test (Solutions): Statistics Free PDF Download
Importance of Unit Test (Solutions): Statistics
Unit Test (Solutions): Statistics Notes
Unit Test (Solutions): Statistics Class 10 Questions
Study Unit Test (Solutions): Statistics on the App
|
© EduRev
|
Education Revolution
|


|


