Unit Test: Statistics | Mathematics (Maths) Class 9 PDF Download

Time: 1 hour
M.M. 30
Attempt all questions.
Question numbers 1 to 5 carry 1 mark each.
Question numbers 6 to 8 carry 2 marks each.
Question numbers 9 to 11 carry 3 marks each.
Question numbers 12 & 13 carry 5 marks each.
Q1. Name a graphical representation where frequencies are represented by line segments. (1 Mark)
Q2. What is the formula to find the class mark of a class interval? (1 Mark)
Q3. If the class limits are 30–40, what is the class size? (1 Mark)
Q4. Why is a kink or break shown in a histogram sometimes? (1 Mark)
Q5. The class mark of the class 90-120 is (1 Mark)
(a) 90
(b) 105
(c) 115
(d) 120
Q6. The blood groups of 30 students are recorded as follows:
A, B, O, A, AB, O, A, O, B, A, O, B, A, AB, B, A, AB, B,
A, A, O, A, AB, B, A, O, B, A, B, A
Prepare a frequency distribution table for the data. (2 Marks)
Q7. The points scored by a basketball team in a series of matches are as follows: (2 Marks)
17, 7, 10, 25, 5, 10, 18, 10 and 24. Find the range.
Q8. The width of each of the five continuous classes in a frequency distribution is 5, and the lower class limit of the lowest class is 10. The upper-class limit of the highest class is
(a) 15
(b) 25
(c) 35
(d) 40
Q9. The points scored by a basket ball team in a series of matches are as follows:
17, 2, 7, 27, 25, 5, 14, 18, 10, 24, 48, 10, 8, 7, 10, 28
Find the median and mode for the data. (3 Marks)
Q10. If the mean of the following data is 20.2, find the value of p: (3 Marks)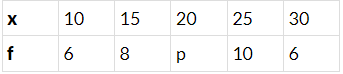
Q11. The number of family members in 10 flats of society is
2, 4, 3, 3, 1, 0, 2, 4, 1, 5.
Find the mean number of family members per flat. (3 Marks)
Q12. The marks obtained (out of 100) by a class of 80 students are given below: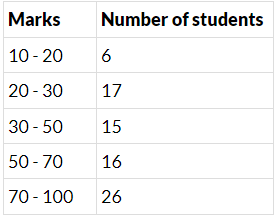
Construct a histogram to represent the data above. (5 Marks)
Q13. The expenditure of a family on different heads in a month is given below: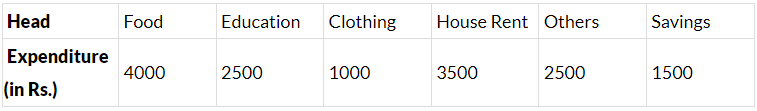
Draw a bar graph to represent the data above. (5 Marks)
|
40 videos|471 docs|57 tests
|
FAQs on Unit Test: Statistics - Mathematics (Maths) Class 9
| 1. What is the importance of statistics in everyday life? |  |
| 2. What are the basic concepts of statistics that Class 9 students should know? | |
| 3. How can graphical representation enhance the understanding of statistical data? | |
| 4. What role does probability play in statistics? | |
| 5. How do Class 9 exams assess students' understanding of statistics? | |


Unit Test: Statistics | Mathematics (Maths) Class 9
,Semester Notes
,Previous Year Questions with Solutions
,Free
,Sample Paper
,MCQs
,study material
,shortcuts and tricks
,mock tests for examination
,Exam
,Important questions
,Unit Test: Statistics | Mathematics (Maths) Class 9
,Extra Questions
,Summary
,ppt
,Objective type Questions
,Unit Test: Statistics | Mathematics (Maths) Class 9
,video lectures
,practice quizzes
,Viva Questions
,past year papers
;


Unit Test: Statistics Free PDF Download
Importance of Unit Test: Statistics
Unit Test: Statistics Notes
Unit Test: Statistics Class 9 Questions
Study Unit Test: Statistics on the App
|
© EduRev
|
Education Revolution
|


|


