Word Problems: Data Through Pictures | Mathematics (Maths Mela) Class 5 - New NCERT PDF Download

Q1: Is the bar graph can be drawn using vertical bars?
Solution:
Yes, the bar graph can be drawn using vertical bars as well as horizontal bars.
Q2: The representation of data through pictures is known as _____.
Solution:
Pictograph helps to represent the data through pictures.
Q3: The following pictograph shows the number of letters collected from a post box on each day of a particular week.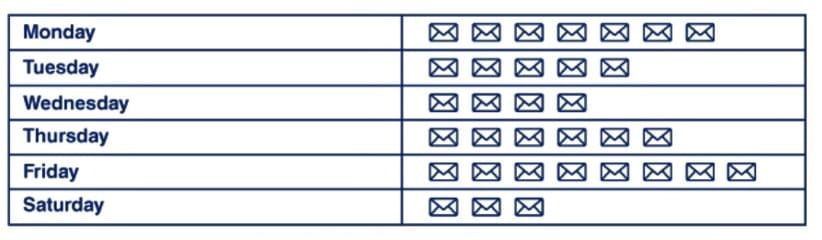
(Hint: Each letter symbol represents 10 letters)
On which day, the minimum number of letters were collected?
(a) Tuesday
(b) Thursday
(c) Friday
(d) Saturday
Solution:
Given that, each letter symbol represents 10 letters.
Hence, Monday = 70 letters
Tuesday = 50 letters
Wednesday = 40 letters
Thursday = 60 letters
Friday = 80 letters
Saturday = 30 letters
Therefore, the minimum number of letters were collected on Saturday.
Q4: If H represents 5 hens, then how many hens does HHHH represent?
Solution:
Given that, H = 5 Hens
Hence, HHHH = (5 + 5 + 5 + 5) hens
HHHH = 20 hens.
Therefore, HHHH represents 20 hens.
Q5: If each ⇑ symbol represents 15 houses, then ⇑⇑⇑⇑ represents how many houses?
Solution:
Given that, ⇑ = 15 houses
Hence, ⇑⇑⇑⇑ = (15 + 15 + 15 + 15 ) houses
⇑⇑⇑⇑ = 60 houses.
Therefore, ⇑⇑⇑⇑ represents 60 houses.
Q6: The bar graph shows the frequency of a, e, i, o, u in the piece of English writing.
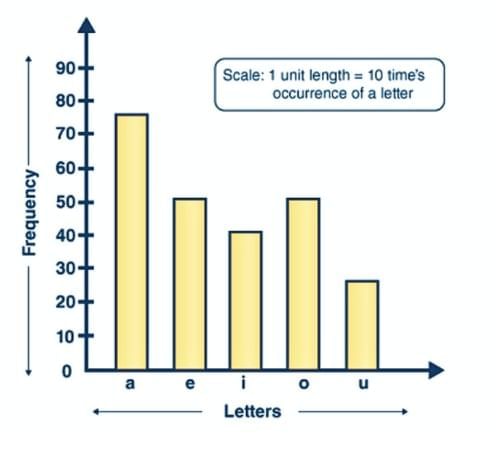
- Which letter has occurred the maximum number of times?
- Which letter has occurred less than 30 times?
- Write down the 5 letters in the decreasing order of frequency?
Solution: From the bar graph, it is observed that,
- The letter that has occurred the maximum number of times is “a”.
- The letter that has occurred less than 30 times is “u”.
- Five letters in the decreasing order of frequency are a, e, o, i, u.
Q7: Look at the below-given pictograph, answer the following questions: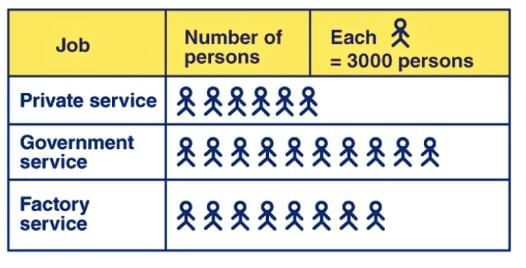
(a) Find out the number of persons employed in private service?
(b) In which service, the maximum number of persons were employed?
Solution:
Given that, one symbol = 3000 persons.
(a) The number of persons employed in private service = 6 × 3000 = 18000 persons.
(b) The maximum number of persons were employed in government service.
I.e., 10 × 3000 = 30000 persons.
Q8. In a pictograph, one picture of a ball represents 10 balls. If there are 5 pictures, how many balls are there?
(a) 25
(b) 50
(c) 100
(d) 10
Ans: (b) 50
Q9. A bar graph shows the number of chocolates eaten by 4 friends: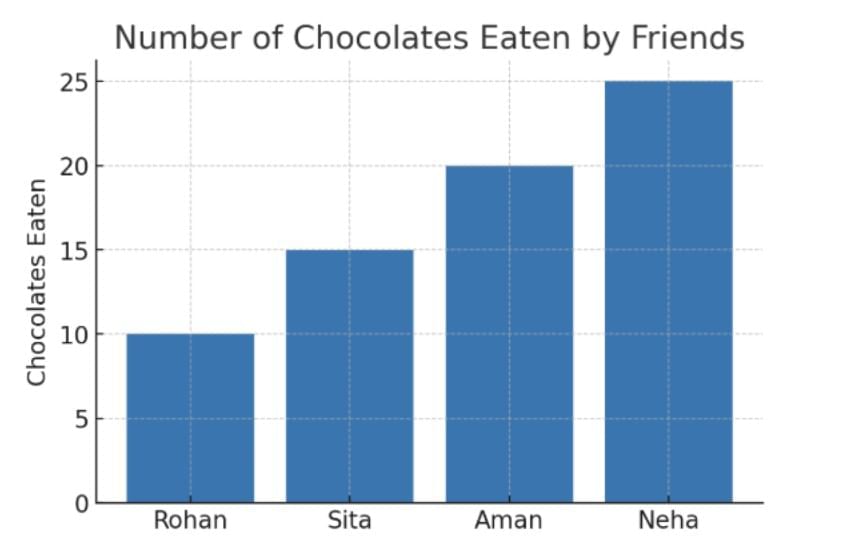
Who ate the most chocolates?
(a) Rohan
(b) Neha
(c) Sita
(d) Aman
Ans: (b) Neha
Q3. A bar graph shows the sale of fruits in a shop:
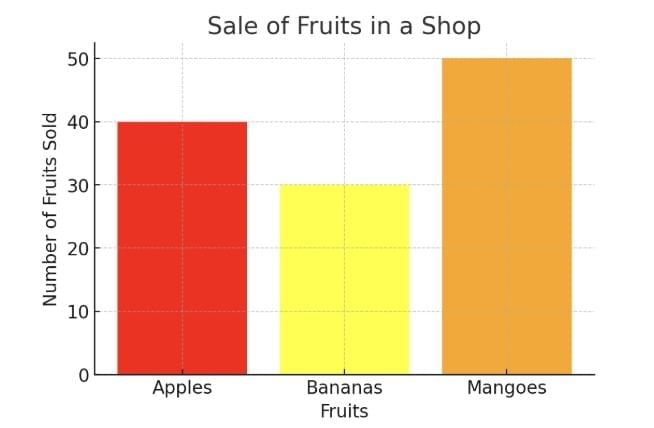 Which fruit was sold the least?
(a) Mangoes
(b) Apples
(c) Bananas
(d) All equal
Ans: (c) Bananas
|
35 videos|276 docs|7 tests
|
FAQs on Word Problems: Data Through Pictures - Mathematics (Maths Mela) Class 5 - New NCERT
| 1. What are data through pictures, and why are they important in understanding word problems? |  |
| 2. How can I effectively interpret data presented in graphs or charts for word problems? | |
| 3. What strategies can be used to solve word problems involving data through pictures? | |
| 4. How can I practice data interpretation skills for word problems? | |
| 5. What role do visuals play in enhancing comprehension of mathematical concepts in word problems? | |


Important questions
,ppt
,Previous Year Questions with Solutions
,video lectures
,Viva Questions
,Word Problems: Data Through Pictures | Mathematics (Maths Mela) Class 5 - New NCERT
,mock tests for examination
,shortcuts and tricks
,Extra Questions
,Summary
,past year papers
,Free
,Exam
,study material
,Sample Paper
,Word Problems: Data Through Pictures | Mathematics (Maths Mela) Class 5 - New NCERT
,practice quizzes
,MCQs
,Word Problems: Data Through Pictures | Mathematics (Maths Mela) Class 5 - New NCERT
,Objective type Questions
,Semester Notes
;


Word Problems: Data Through Pictures Free PDF Download
Importance of Word Problems: Data Through Pictures
Word Problems: Data Through Pictures Notes
Word Problems: Data Through Pictures Class 5 Questions
Study Word Problems: Data Through Pictures on the App
|
© EduRev
|
Education Revolution
|


|


