Chapter Notes – National Income Accounting | Economics Class 12 - Commerce PDF Download
Introduction
Understanding the basic concepts of macroeconomics is crucial for comprehending how economies function on a large scale. Macroeconomics delves into aggregate economic variables, such as GDP, national income, and the circular flow of income. By examining these concepts, we can better grasp the dynamics of economic growth, the distribution of wealth, and the factors influencing national welfare.

Some Basic Concepts of Macroeconomics
- Macro Economics: Macroeconomics is the study of aggregate economic variables of an economy.
- Consumption goods: These are those which are bought by consumers as final or ultimate goods to satisfy their wants.
Example: Durable goods like cars, television, radio etc.
Non-durable goods and services like fruit, oil, milk, vegetables etc.
Semi-durable goods such as crockery etc. - Capital goods: capital goods are those final goods, which are used and help in the process of production of other goods and services.
Example: plant, machinery etc. - Final goods: These are those goods, that are used either for final consumption or for investment. It includes final consumer goods and final production goods. They are not meant for resale. So, no value is added to these goods. Their value is included in the national income.
- Intermediate goods: intermediate goods are those goods, which are used either for resale or for further production. An example of an intermediate good is- milk used by a tea shop for selling tea.
- Stock: Quantity of an economic variable that is measured at a particular point in time. A stock variable has no time dimension. Stock is a static concept.
Example: wealth, water in a tank. - Flow: Flow is the quantity of an economic variable, which is measured during a period of time. Flow has time dimensions like per hr, per day etc.
Flow is a dynamic concept.
Example: Investment, water in a stream. - Investment: Investment is the net addition made to the existing stock of capital.
- Net Investment = Gross investment – depreciation.
- Depreciation: depreciation refers to fall in the value of fixed assets due to normal wear and tear, passage of time and expected obsolescence.
Circular flow of Income and Methods of Calculating National Income
The circular flow of income represents the continuous movement of production, income, and expenditure within an economy. It demonstrates how income is redistributed in a circular pattern between production units and households.
Factors of Production and Payments:
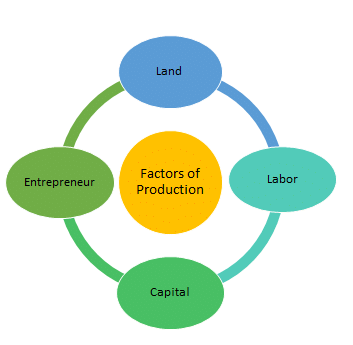
- Land: Payment is called rent.
- Labour: Payment is called wage.
- Capital: Payment is called interest.
- Entrepreneurship: Payment is called profit.
Circular Flow of Income in a Two-Sector Economy
The circular flow in a two-sector economy illustrates the flow of payments and receipts for goods, services, and factor services between households and firms.
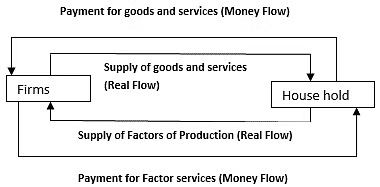
Explanation:
- The outer loop shows the flow of factor services (land, labour, capital, entrepreneurship) from households to firms and the corresponding flow of factor payments (rent, wages, interest, profit) from firms to households.
- The inner loop depicts the flow of goods and services from firms to households and the corresponding flow of consumption expenditure from households to firms.
- All the money paid by firms as factor payments is eventually returned to the firms by the factor owners (households) through their consumption expenditures.
Methods of Calculating National Income
National income can be determined using three main methods:
- Value Added Method
- Expenditure Method
- Income Method

The Product or Value Added Method
- Value Added is a method of calculating the National Income of an economy in different production phases in a circular flow.
- The production process of a good or service involves different production units. The value-added method shows the value added or contribution of such units.
- Every enterprise of industry adds some value to a final product, and for its production, it purchases some intermediate goods from other firms.
- To calculate the National Income of an economy, the value added by each of these individual firms to the final product is summed up.
- Other names of Value Added Method are Product Method, Inventory Method, Commodity Service Method, Industrial Origin Method, and Net Output Method.

- To calculate the National Income of an economy, first of all, the Gross Value Added is calculated.
- The formula for calculating Gross Value Added(GVAMP) is

The formula for calculating National Income through Value Added Method is,

Example 1: Determine the following with the help of the given information:
i) Value of Output
ii) Net Value Added at Factor Cost

Solution:
i) Value of Output = Sales + Increase in Unsold Stock
Value of Output = 12,800 + 1,000
Value of Output = ₹13,800 Crores
ii) Net Value Added at Factor Cost (NVAFC) = Sales + Increase in Unsold Stock – Purchase of Raw Materials – Depreciation – (Indirect Tax – Subsidies)
NVAFC = 12,800 + 1,000 – 3,400 – 400 – (900 – 200)
Net Value Added at Factor Cost (NVAFC) = ₹9,300 Crores
Double Counting in the Value-Added Method
Double counting refers to the error that occurs when the value of a product is counted multiple times in different stages of production. This usually happens when the intermediate goods' value is included alongside the final product value, resulting in an inflated national income calculation.
Example to Illustrate Double Counting
Let's break down the problem of double counting with an example involving a farmer, miller, and baker:
- Farmer: Produces wheat and sells it for ₹200 to a flour mill.
- Miller: Converts wheat into flour and sells it for ₹500 to a baker.
- Baker: Makes biscuits from the flour and sells them for ₹700 to consumers.
If we sum the values of outputs at each stage:
- Value of wheat: ₹200
- Value of flour: ₹500 (includes the wheat's value)
- Value of biscuits: ₹700 (includes the flour's value)
Adding these values directly results in ₹1400 (₹200 + ₹500 + ₹700), which incorrectly includes the intermediate values multiple times.
Avoiding Double Counting
To avoid double counting, the value-added method can be used. This method involves summing the value added at each production stage:
- Farmer's value-added: ₹200 (no intermediate costs)
- Miller's value-added: ₹300 (₹500 - ₹200)
- Baker's value-added: ₹200 (₹700 - ₹500)
The correct total value added is ₹700 (₹200 + ₹300 + ₹200), which represents the actual addition to the economy without double counting.
Income method
- The Income Method calculates the National Income of an economy based on the idea that whatever the firm earns in exchange for goods and services is used to make the factor payments.
- In other words, to calculate the national income of an economy through the Income Method, the incomes received by residents of a country for the productive services provided by them during a year are added together.
- The incomes for the productive services or factors of production are received by the residents in the form of profits, wages, interest, rent, etc.

- Other names for Income Method are Distributive Share Method and Factor Payment Method.
- The formula for calculating National Income by Income Method is

Example 1: Calculate the Operating Surplus with the help of the following data:

Solution:
Operating Surplus = Sales – Intermediate Consumption – Compensation of Employees – Net Indirect Taxes – Consumption of Fixed Capital – Mixed Income
Operating Surplus = 5,000 – 500 – 900 – 340 – 160 – 350
Operating Surplus = ₹2,750 Crores
Example 2: Calculate National Income with the help of the following data:

Solution:
National Income (NNPFC) = Compensation of Employees + Operating Surplus + Mixed Income of Self-Employed + Net Factor Income from Abroad
NNPFC = 14,000 + 4,500 + 17,200 + 400
National Income (NNPFC) = ₹36,100 Crores
Expenditure Method
- The Expenditure Method of calculating National Income takes the final expenditures of an economy into consideration.
- The factor income earned by different factors of production is spent by the different sectors of an economy in the form of expenditure on the purchase of goods and services manufactured by the firms.
- Under this method, all these final expenditures incurred on the purchase of goods and services by the government, households, foreigners, and business firms are added together.

- Another name for the Expenditure Method is the Income Disposable Method.
- To calculate the National Income of an economy, first of all, the sum total of all the final expenditures is determined using the formula.

The formula for calculating National Income through Expenditure Method is,

Example 1: Calculate GDP at MP with the help of the following data:
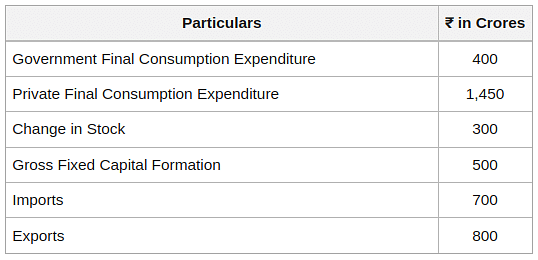
Solution:
GDPMP = Private Final Consumption Expenditure + Government Final Consumption Expenditure + Gross Fixed Capital Formation + Change in Stock + (Exports – Imports)
GDPMP = 1,450 + 400 + 500 + 300 + (800 – 700)
GDPMP = ₹2,750 Crores
Example 2: Calculate Gross Fixed Capital Formation from the following information:
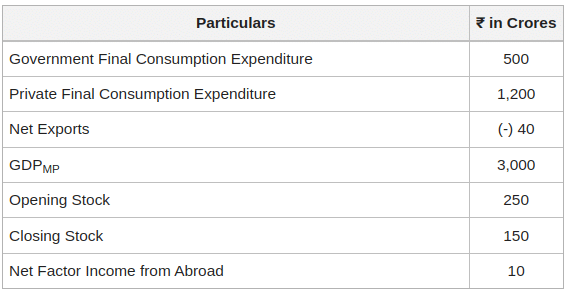
Solution:
Gross Fixed Capital Formation = GDPMP – Private Final Consumption Expenditure – Government Final Consumption Expenditure – Net Exports – (Closing Stock – Opening Stock)
Gross Fixed Capital Formation = 3,000 – 1,200 – 500 – (-) 40 – (150 – 250)
Gross Fixed Capital Formation = ₹1,440 Crores
Factor Cost, Basic Prices and Market Prices
GDP at Factor Cost- Previously the most highlighted measure of national income in India.
- Reports the GDP excluding any taxes or subsidies.
GDP at Market Prices
- Also called "GDP".
- Includes the total indirect taxes and deducts total subsidies from the factor cost.
- Currently the most highlighted measure of national income by the Central Statistics Office (CSO) of India.
Gross Value Added (GVA) at Basic Prices
- Introduced by the CSO in January 2015 to replace GDP at factor cost.
- Represents the value of total output minus the value of intermediate consumption.
- Includes net production taxes but excludes net product taxes.
Factor Cost
- The cost of production includes only the payments to factors of production (labour, capital, land, and entrepreneurship).
- Does not include any taxes.
Basic Prices
- Include production taxes (less production subsidies) but exclude product taxes (less product subsidies).
- Lie between factor cost and market prices.
Market Prices:
- Include both production and product taxes (less subsidies).
- Reflect the prices paid by consumers.
Taxes and Subsidies:
- Production Taxes: Taxes paid in relation to production, independent of production volume (e.g., land revenues, stamp, and registration fees).
- Production Subsidies: Subsidies received in relation to production, independent of production volume.
- Product Taxes: Taxes paid per unit or product (e.g., excise tax, service tax, export and import duties).
- Product Subsidies: Subsidies received per unit or product.
Implications:
- GDP at Market Prices is the comprehensive measure reflecting the actual prices paid in the market including all indirect taxes and subsidies.
- GVA at Basic Prices provides a measure of value added in the economy accounting for production taxes and subsidies but excluding product taxes and subsidies.
- The transition from GDP at factor cost to GVA at basic prices aligns India's national income accounting with international standards.
Some Macroeconomic Identities
Gross Domestic Product (GDP)

- Measures aggregate production of final goods and services within the domestic economy during a year.
- Does not account for income earned abroad by citizens or foreign income within the domestic economy.
Gross National Product (GNP)
- Adjusts GDP to include income earned by domestic factors of production employed abroad and subtracts income earned by foreign factors of production in the domestic economy.
- Formula: GNP = GDP + Net Factor Income from Abroad (NFIA)
- NFIA = Factor income earned by domestic factors abroad - Factor income earned by foreign factors domestically.
Net National Product (NNP)
- Accounts for depreciation, the wear and tear of capital.
- Formula: NNP = GNP - Depreciation
Net National Product at Factor Cost (National Income - NI)
- Adjusts NNP by subtracting indirect taxes and adding subsidies to reflect the income accruing to factors of production.
- Formula: NNP at Factor Cost = NNP at Market Prices - Net Indirect Taxes
- Net Indirect Taxes = Indirect taxes - Subsidies
Personal Income (PI)
- Represents the income received by households from National Income.
- Deducts undistributed profits, corporate taxes, and net interest payments made by households.
- Adds transfer payments received by households from government and firms.
- Formula: PI = NI - Undistributed Profits - Net Interest Payments - Corporate Tax + Transfer Payments
Personal Disposable Income (PDI)
- Income is available to households after paying personal taxes and non-tax payments.
- Formula: PDI = PI - Personal Tax Payments - Non-tax Payments
Summary of Relations
- GDP: Measures domestic production.
- GNP: Adjusts GDP for international income flows.
- NNP: Adjusts GNP for capital depreciation.
- NI: Adjusts NNP for indirect taxes and subsidies to reflect income to factors of production.
- PI: Adjusts NI for undistributed profits, corporate taxes, net interest payments, and transfer payments.
- PDI: Adjusts PI for personal and non-tax payments to reflect the actual disposable income of households.
Diagram (Conceptual)
- GDP → GNP → NNP → NI → PI → PDI
Formulas
- GDPMP = Net domestic product at FC (NDPFC) + Depreciation + Net Indirect tax
- GDPFC = GDPMP – Net Indirect tax
- NDPFC = GDPMP – Net Indirect tax – Depreciation
- NNPFC = GNPMP – Net Indirect Taxes – Depreciation
- GNPFC = GNPMP – Net Indirect Taxes
- GNPFC = NNPFC + Depreciation or
- GNPFC = GDPFC + NFIA
- NNPMP = GNPMP – Depreciation
- NNPMP = NNPFC + Net Indirect Taxes
- GNPMP = NNPFC + Net Indirect Taxes + Depreciation
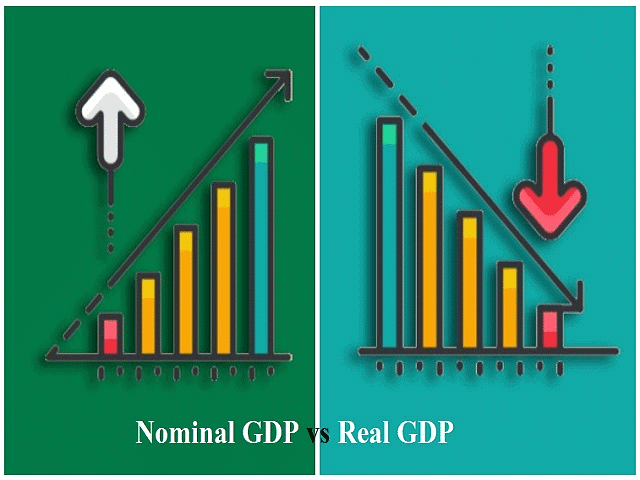
Nominal and Real GDP
 Nominal GDP:
- Measures the value of all finished goods and services produced within a country’s borders at current market prices.
- Does not account for changes in price levels or inflation.
- Example:
- Year 2000: 100 units of bread at Rs 10 per bread = Rs 1,000.
- Year 2001: 110 units of bread at Rs 15 per bread = Rs 1,650.
Real GDP:
- Measures the value of all finished goods and services produced within a country’s borders at constant prices (base year prices).
- Adjusts for changes in price levels to reflect true economic growth.
- Example:
- Year 2001 (using year 2000 prices): 110 units of bread at Rs 10 per bread = Rs 1,100.
Importance of Real GDP
- Allows for comparison over different periods by eliminating the effect of inflation.
- Ensures that changes in GDP reflect actual changes in the volume of production rather than price changes.
GDP Deflator
- Index that measures the change in prices of all goods and services included in GDP.
- Formula: GDP Deflator = (Nominal GDP / Real GDP) × 100
- Example:
- Nominal GDP = Rs 1,650
- Real GDP = Rs 1,100
- GDP Deflator = (1650 / 1100) × 100 ≈ 150%
- Indicates that the price level in the current year is 1.5 times the price level in the base year.
- Example:
Consumer Price Index (CPI)
- Measures the average change in prices paid by consumers for a market basket of goods and services.
- Formula: CPI = (Cost of basket in current year / Cost of basket in base year) × 100
- Example:
- Base Year (2000): 90 kg of rice at Rs 10/kg + 5 pieces of cloth at Rs 100/piece = Rs 1,400.
- Current Year (2005): 90 kg of rice at Rs 15/kg + 5 pieces of cloth at Rs 120/piece = Rs 1,950.
- CPI = (1950 / 1400) × 100 ≈ 139.29%
Wholesale Price Index (WPI)
- Measures the average change in prices of goods at the wholesale level.
- Known as the Producer Price Index (PPI) in some countries like the USA.
- Differences from CPI:
- CPI includes prices of imported goods; the GDP deflator does not.
- CPI has constant weights; GDP deflator weights vary with production levels.
- CPI reflects prices paid by consumers; WPI reflects wholesale prices.
GDP and Welfare
While GDP measures the aggregate production of final goods and services within a country, it does not necessarily reflect the welfare of the people. Here are three main reasons why GDP may not be a good index of welfare:
Distribution of GDP:
- Uniformity of Distribution: Rising GDP does not imply improved welfare if the increase is concentrated in the hands of a few.
- Example:
- The year 2000: 100 individuals earning Rs 10 each, GDP = Rs 1,000.
- The year 2001: 90 individuals earning Rs 9 each, 10 earning Rs 20 each, GDP = Rs 1,010.
- Despite higher GDP, 90% of people experienced a 10% drop in real income, showing that GDP increase does not equate to overall welfare improvement.
Non-monetary Exchanges:
- Barter and Informal Sector: Many economic activities, especially in developing countries, are not evaluated in monetary terms and hence are not counted in GDP.
- Example: Domestic services performed by women at home and barter exchanges in underdeveloped regions.
- Underestimation: GDP calculated in the standard manner may underestimate the actual productive activity and well-being.
Externalities:
- Positive and Negative Externalities: Benefits or harms caused by firms or individuals that are not accounted for in market transactions.
- Example of Negative Externality: An oil refinery polluting a nearby river harms the well-being of people using the river and affects the livelihood of fishermen, but these costs are not subtracted from GDP.
- Overestimation and Underestimation: Negative externalities lead to overestimation of welfare, while positive externalities, if any, lead to underestimation.

Conclusion
Macroeconomic concepts provide a foundation for understanding the broader economic environment. From the production and consumption of goods to the intricate flow of income and the calculation of national income, these concepts help us analyze and interpret the overall economic health and welfare of a nation. Despite GDP being a critical measure, it has its limitations in reflecting true welfare, necessitating a comprehensive look at distribution, non-monetary exchanges, and externalities.
|
64 videos|275 docs|52 tests
|
FAQs on Chapter Notes – National Income Accounting - Economics Class 12 - Commerce
| 1. What is the circular flow of income in macroeconomics? |  |
| 2. What are the different methods of calculating national income? |  |
| 3. What is the difference between nominal GDP and real GDP? |  |
| 4. How do factor cost, basic prices, and market prices differ in national income accounting? |  |
| 5. How does GDP relate to welfare in an economy? |  |

|
Explore Courses for Commerce exam
|

|


