Class 9 Maths Chapter 13 Question Answers - Statistics

Q1: For a particular year, following is the distribution of ages (in years) of primary school teachers in a district :
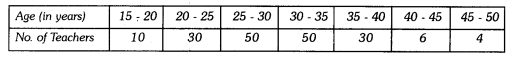
(i) Write the lower limit of first class interval.
(ii) Determine the class limits of the fourth class interval.
(iii) Find the class mark of the class 45 – 50.
(iv) Determine the class size.
Ans:
(i) First class interval is 15 – 20 and its lower limit is 15.
(ii) Fourth class interval is 30 – 35
Lower limit is 30 and upper limit is 35.
(iii) Class mark of the class 45 – 50 = 45 + 50 / 2 = 95/2 = 47.5
(iv) Class size = Upper limit of each class interval – Lower limit of each class interval
∴ Here, class size = 20 – 15 = 5
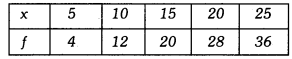
Q2: Find the mean of the following distribution :
 Ans:
Ans: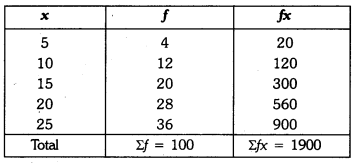 Now,
Now,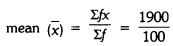
= 19
Q3: In figure, there is a histogram depicting daily wages of workers in a factory. Construct the frequency distribution table.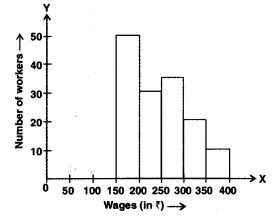 Ans:
Ans: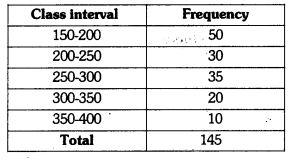
Q4: Ten observations 6, 14, 15, 17, x + 1, 2x – 13, 30, 32, 34, 43 are written in ascending order. The median of the data is 24. Find the value of x.
Ans:
Here, the arranged data is 6, 14, 15, 17, x + 1, 2x – 13, 30, 32, 34, 43
Total number of observations = 10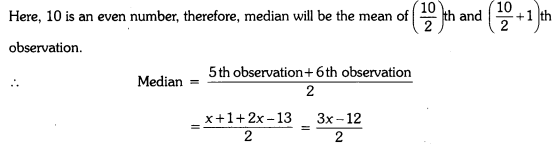
But median of data is 24 (given)
⇒ 3x−12 / 2 = 24
⇒ 3x – 12 = 48
⇒ 3x = 60
⇒ x = 20
∴ The value of x = 20
Q5: Draw a histogram for the given data :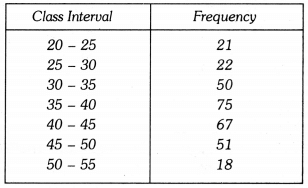 Ans:
Ans:
Let us represent class-intervals along x-axis and corresponding frequencies along y-axis on
a suitable scale, the required histogram is as under : 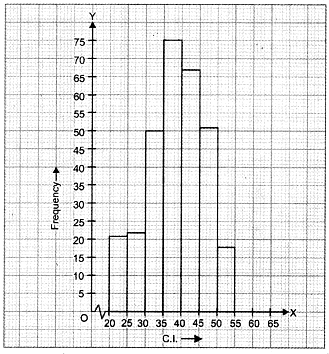
Q6: Given are the scores (out of 25) of 9 students in a Monday test :
14, 25, 17, 22, 20, 19, 10, 8 and 23
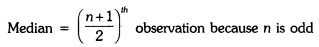
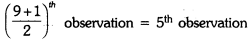
Find the mean score and median score of the data.
Ans:
Ascending order of scores is :
8, 10, 14, 17, 19, 20, 22, 23, 25
Now, Mean Score = 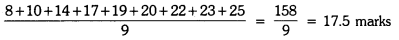
= 
= 19 marks
Q7: Draw a histogram of the weekly pocket expenses of 125 students of a school given below :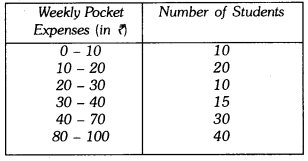 Ans: Here, the class sizes are different, so calculate the adjusted frequency for each class by using the formula.
Minimum class size Frequency density or adjusted frequency for a class
= 
Here, the minimum class size = 10 – 0 = 10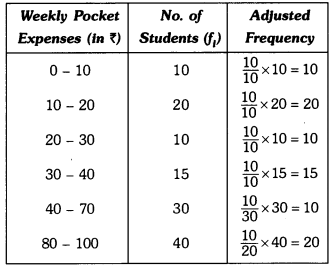 Let us represent weekly pocket money along x-axis and corresponding adjusted frequencies along y-axis on a suitable scale, the required histogram is as given below :
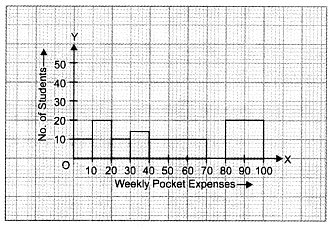
Q8: The weight in grams of 35 mangoes picked at random from a consignment are as follows:
131, 113, 82, 75, 204, 81, 84, 118, 104, 110, 80, 107, 111, 141, 136, 123, 90, 78, 90, 115, 110, 98, 106, 99, 107, 84, 76, 186, 82, 100, 109, 128, 115, 107, 115 From the grouped frequency table by dividing the variable range into interval of equal width of 20 grams, such that the mid-value of the first class interval is 70 g. Also, draw a histogram.
Ans:
It is given that the size of each class interval = 20 and the mid-value of the first class interval is 70.
Let the lower limit of the first class interval be a, then its upper limit = a + 20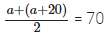
⇒ a = 70 – 10 = 60
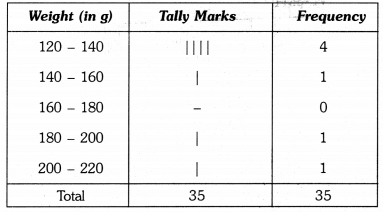
Thus, the first class interval is 60 – 80 and the other class-intervals are 80 – 100, 100 – 120, 120 – 140, 140 – 160, 160 – 180, 180 – 200 and 200 – 220.
So, the grouped frequency table is as under :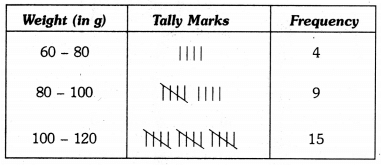
 Let us represent weight (in g) along x-axis and corresponding frequencies along y-axis on a suitable scale, the required histogram is as under :
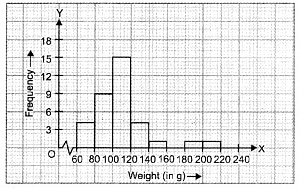
Q9: Find the mean salary of 60 workers of a factory from the following table :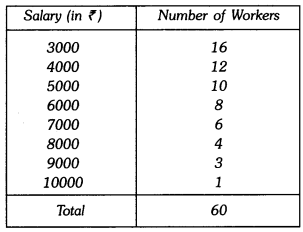 Ans:
Ans: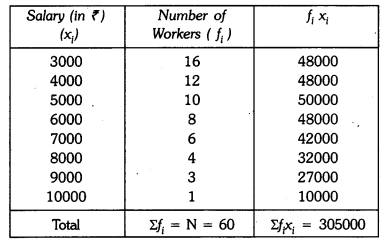
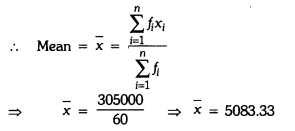
Hence, mean salary of 60 workers is ₹5083.33.
Q10: In a school marks obtained by 80 students are given in the table. Draw a histogram. Also, make frequency polygon.
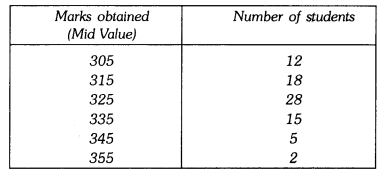 Ans:
Ans:
∴ Lower limit of first class interval is 305 – 10/2 = 300
Upper limit of first class interval is 305 + 10/2 = 310
Thus, first class interval is 300 – 310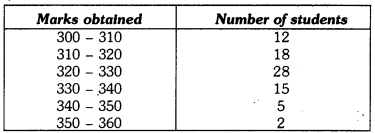 Required histogram and frequency polygon is given on the graph paper.
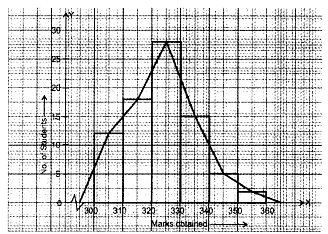
Q11: The following two tables gives the distribution of students of two sections according to the marks obtained by them :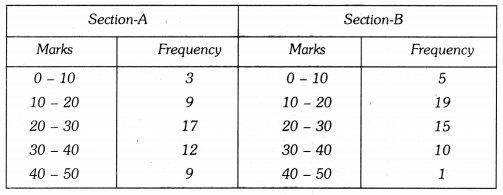 Represent the marks of the students of both the sections on the same graph by two frequency polygons. From the two polygons compare the performance of the two sections.
Ans:
The class marks are as under :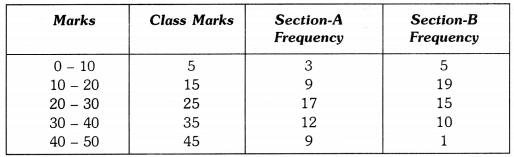 Let us take class marks on X-axis and frequencies on Y-axis. To plot frequency polygon of Section-A, we plot the points (5, 3), (15, 9), (25,17), (35,12), (45, 9) and join these points by (15,19). line segments. To plot frequency polygon of Section-B, we plot the points (5, 5), (15, 19), (25, 15), (35, 10), (45, 1) on the same scale and join these points by dotted line segments.
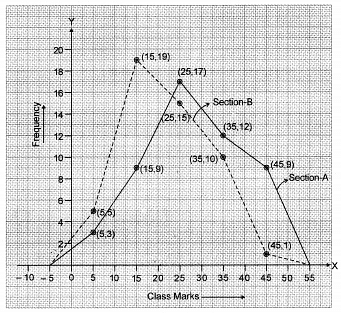 From the above two polygons, clearly the performance of Section A is better.
|
40 videos|420 docs|51 tests
|


practice quizzes
,Objective type Questions
,Class 9 Maths Chapter 13 Question Answers - Statistics
,Exam
,Class 9 Maths Chapter 13 Question Answers - Statistics
,ppt
,Semester Notes
,video lectures
,Previous Year Questions with Solutions
,mock tests for examination
,shortcuts and tricks
,Extra Questions
,Viva Questions
,MCQs
,Important questions
,Free
,study material
,Class 9 Maths Chapter 13 Question Answers - Statistics
,Summary
,past year papers
,Sample Paper
;


Long Question Answer: Statistics Free PDF Download
Importance of Long Question Answer: Statistics
Long Question Answer: Statistics Notes
Long Question Answer: Statistics Class 9 Questions
Study Long Question Answer: Statistics on the App
|
© EduRev
|
Education Revolution
|


|


