Class 8 Maths - Data Handling CBSE Worksheets

Worksheet Questions (Part - 1)
1. Read the following bar-graph and answer the following questions.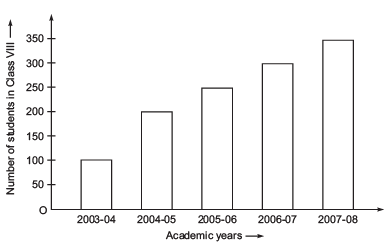
(i) What is the information given by the bar graph?
(ii) In which year is the increase in the number of students is maximum?
(iii) In which year is the number of students maximum?
(iv) Is the number of students during 2005-06 twice that of 2003-04?
2. Read the following bar graph and answer the following questions.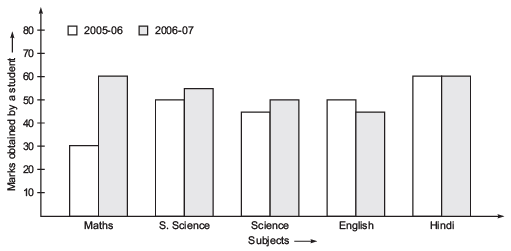
(i) What is the information given by the double bar graph?
(ii) In which subject has the performance improved the most?
(iii) In which subject the performance deteriorated?
(iv) In which subject is the performance at par?
3. A group of students was asked for their favorite subject. The results were listed as under:
| Art, Mathematics, Science, English, Mathematics, Art, English, Mathematics, English, Art, Science, Art, Science, Science, Mathematics, Art, English, Art, Science, Mathematics, Science, Art. |
Answer the following questions:
(i) Which is the most liked subject?
(ii) Which is the least liked subject?
4. Read the following histogram and answer the questions given below: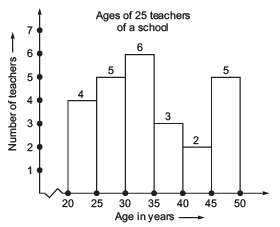
(i) How many teachers are of age 45 years or more but less than 50 years?
(ii) How many teachers are of age less than 35 years?
ANSWERS
1. (i) Number of students in class VIII in different academic years.
(ii) 2004-05
(iii) 2007-08
(iv) No
2. (i) Marks obtained by a student in different subjects by a student in 2005-06 and 2006-07.
(ii) Mathematics
(iii) English
(iv) Hindi
3. (i) Art
(ii) English
4. (i) 5 teachers
(ii) 4 + 5 + 6 = 15 teachers
Worksheet Questions (Part - 2)
1. Read the following circle graphs and answer the questions given below:
(a) The time spent by a child during a day:
(i) On which activity maximum number of hours are spent?
(ii) On which two activities does he spend equal number of hours?
(iii) Find the central angles for each sector of activities.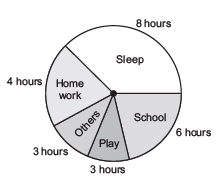
(b) Age group of people in a town:
(i) In which age group are the maximum number of people?
(ii) How many people are there is the ‘0-14 years’ group?
(iii) Find the central angle of the sector corresponding to the age group ’15-60 years’.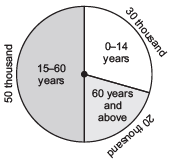
3. The favourate flavours of ice-creams for students of a school is given in percentages as follows:
Flavours | Percentage of students Preferring the flavours |
Chocolate | 50% |
Vanilla | 25% |
Other flavours | 25% |
Represent the data in a pie chart.
4. The adjoining pie chart gives the expenditure (in percentages) on various items and savings of a family during a month.
(i) On which item, the expenditure was minimum?
(ii) Expenditure on which item is equal to the total saving of the family?
(iii) If the monthly saving of the family is Rs 3000, then what is the monthly expenditure on clothes?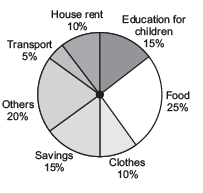
5. On a particular day, the sales (in rupees) of various items of baker’s shop are given below. Draw a pie chart for this data:
| ordinary bread | 320 |
| fruit bread | 80 |
| biscuits | 120 |
| cakes and pastries | 160 |
| others | 40 |
| Total | 720 |
ANSWERS
1. (i) Sleep
(ii) Play and others
(iii) Sleep 120°, school 90°, how work 60°; play 45°, others 45°
2. (i) 15–60 years
(ii) 30 thousand
(iii) 180°
4. (i) Transport
(ii) Education for children
(iii) Rs 2000
Worksheet Questions (Part - 3)
1. List the possible outcomes in the adjoining spinning wheel.
2. (i) A die is thrown. List the possible outcomes.
(ii) What is probability of getting a factor of 6?
Hint: Factors of six are 1, 2, 3 and 6.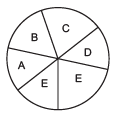
(iii) What is the probability of getting a number greater than 6?
Note: A die does not have a number greater than 6 on its face. Therefore, the possible outcomes are zero.
3. (i) Find the number of outcomes of getting a sector containing G.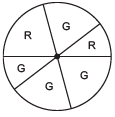
(ii) What is the probability of getting a sector containing R?
4. A bag has 4-red balls and 2 yellow balls such that the balls are identical in all repeats other than colour. A ball is drawn from the bag without looking into the bag. What is the probability of getting yellow ball?
ANSWERS
1. A, B, C, D, E
2. (i) 1, 2, 3, 4, 5, 6
(ii) 2/3
(iii) 0
3. 4
4. 1/3
|
81 videos|452 docs|31 tests
|
FAQs on Class 8 Maths - Data Handling CBSE Worksheets
| 1. What is data handling and why is it important in education? |  |
| 2. What are some common methods of data collection used in data handling? | |
| 3. How can students effectively represent data visually? | |
| 4. What are the key steps involved in analyzing data? | |
| 5. How can data handling skills be applied in real-life situations? | |


practice quizzes
,Semester Notes
,Class 8 Maths - Data Handling CBSE Worksheets
,MCQs
,shortcuts and tricks
,Class 8 Maths - Data Handling CBSE Worksheets
,Exam
,Class 8 Maths - Data Handling CBSE Worksheets
,Sample Paper
,Objective type Questions
,Viva Questions
,ppt
,Previous Year Questions with Solutions
,Important questions
,mock tests for examination
,Extra Questions
,study material
,video lectures
,Summary
,past year papers
,Free
,


Worksheet Questions - Data Handling Free PDF Download
Importance of Worksheet Questions - Data Handling
Worksheet Questions - Data Handling Notes
Worksheet Questions - Data Handling Class 8
Study Worksheet Questions - Data Handling on the App
|
© EduRev
|
Education Revolution
|


|


