Population | IBPS PO Prelims & Mains Preparation - Bank Exams PDF Download
| Table of contents |
|
| Introduction |
|
| Demographic Transition Theory |
|
| Population Composition |
|
| Rural-Urban Composition, Census 2011 |
|
Introduction
- The most important resource to a nation is its people.
- The current population of India is at 138.26 crores (2020), according to UN data.
- Population of India is equivalent to 17.7% of the total world population. India ranks number 2 in the list of countries (and dependencies) by population.
- According to estimates in a recently released United Nations report, India is expected to add 273 million people by the year 2050.
- More often, it is argued that such a large population invariably puts pressure on its limited resources and is also responsible for many socio-economic problems in the country.
- Decadal Growth rate of Population in India between 2001-2011 was 17.64%. It decreased from 21.54% during 1991-2001.
- India’s population is larger than the total population of North America, South America and Australia put together.
- The individual states of India have population comparative to the population of many countries.
Important Definitions
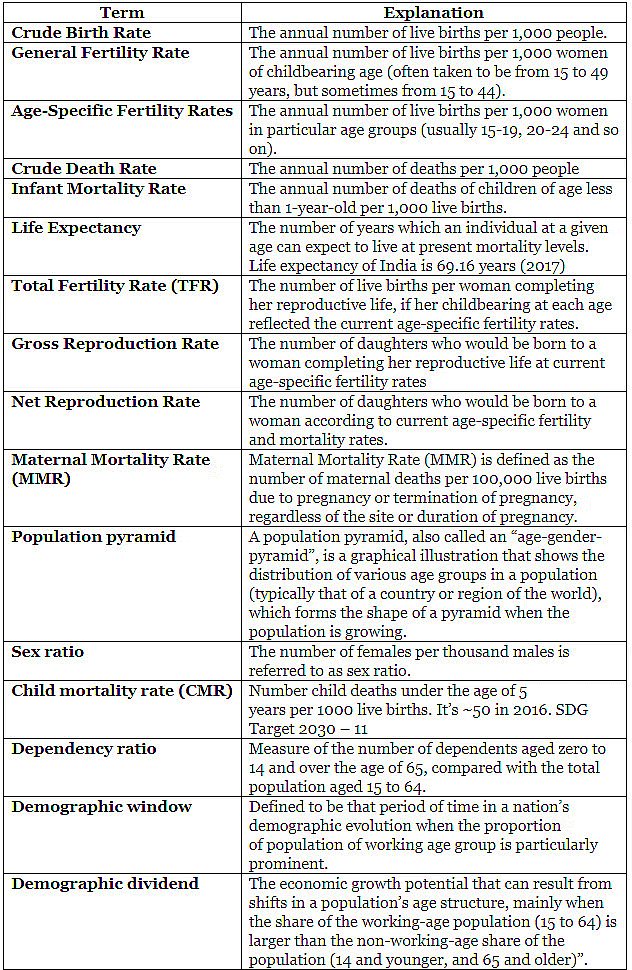
Important Definitions
- India has a highly uneven pattern of population distribution.
- The percentage shares of population of the states and Union Territories in the country show that Uttar Pradesh has the highest population followed by Maharashtra, Bihar and West Bengal.
- P., Maharashtra, Bihar, West Bengal, Andhra Pradesh along with Tamil Nadu, Madhya Pradesh, Rajasthan, Karnataka and Gujarat, (10 states) together account for about 76 per cent of the total population of the country.
- Some states like UP, Maharashtra, Bihar, West Bengal, Andhra Pradesh etc. are very densely populated. While States like Arunachal Pradesh, Uttarakhand and UT like Jammu & Kashmir and Ladakh have very less population density.
- The national population density is 382 persons per square kilometer. But the population is unevenly distributed.
- There has been a steady increase of more than 200 persons per sq km over the last 50 years, as the density of population increased from 117 persons/ sq km in 1951 to 382 persons/sq km in 2011.
- Population density is low in mountainous and desert areas like in Ladakh, western Rajasthan etc.
- Such an uneven spatial distribution of population in India suggests a close relationship between population and physical, socioeconomic and historical factors.
- The density of population is crude measure to study the population pressure on land.
- To get a better insight into the human-land ratio in terms of pressure of population on total cultivable land, the physiological and the agricultural densities should be found out which are significant for a country like India having a large agricultural population.
Factors influencing the distribution of population distribution in India.
- Physical Factors
- Historical Factors
- Socio-economic Factors
Physical Factors
Climate
- Regions with harsh climate are sparsely populated.
- Example: Western Rajasthan has low density of population owing to the arid climate.
- Example: Coastal areas from Gujarat to West Bengal are densely populated due to moderate climate.
Terrain
- People avoid rugged and harsh terrains. Plain areas with minimal relief are favored by the people for settlements.
- Example: North Indian Plains, deltas and Coastal Plains have higher proportion of population than the plateaus and hills of southern and central Indian States & Himalayan States.
Availability of Water
- River plains, coastal areas and areas around lakes and ponds are densely populated.
- Example: Development of irrigation canal (Indira Gandhi Canal) in western Rajasthan have resulted in greater density of population in the region.
Availability of Mineral Resources
- Mineral wealth of a region attracts settlers.
- Example: In spite of rugged terrain, large number of people reside in mineral rich plateaus of Jharkhand, Chhattisgarh and Odisha.
Socio-Economic Factors
Availability of Fertile Farmlands
- One reason for high population density in the North Indian plains is presence of large tracts of fertile plains where subsistence agriculture can feed a large population.
Developed Transport System
- Development of transport facilities is easier over plains.
- Limited scope for transportation in hilly regions deters large population density in these areas.
Industrialisation & Urbanisation
- Development of industries and the resultant urbanization also encourages the concentration of population and migration from rural areas.
- Thus, highly urbanized and industrialized regions have high population density.
- Example: urban regions of Delhi, Mumbai, Kolkata, Bengaluru, Pune, Ahmedabad, Chennai and Jaipur have high concentration of population due to industrial development and urbanisation drawing a large number of rural- urban migrants.
Historical Factors
- It is observed that the regions falling in the river plains and coastal areas of India have remained the regions of larger population concentration.
- Even though the uses of natural resources like land and water in these regions have shown the sign of degradation, the concentration of population remains high because of an early history of human settlement and development of transport network.
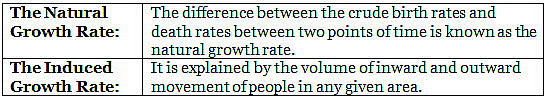
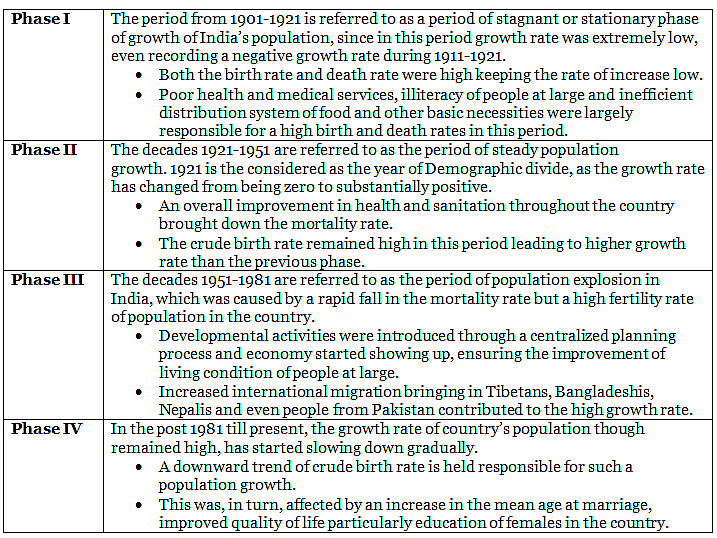
Growth of Population
- Growth of population is the change in the number of people living in a particular area between two points of time. Its rate is expressed in percentage.
- The growth rate of population in India over the last one century has been caused by annual birth rate and death rate and rate of migration and thereby shows different trends.

- There are four distinct phases of growth identified within the last century:
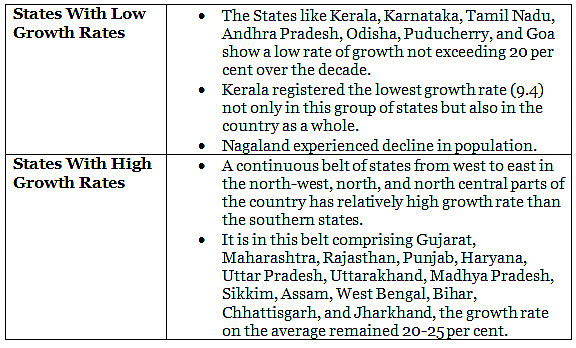
Regional Variation In Population Growth
- The States like Kerala, Karnataka, Tamil Nadu, Andhra Pradesh, Odisha, Puducherry, and Goa show a low rate of growth not exceeding 20 per cent over the decade. (1991-2001)
- During 2001-2011, the growth rates of almost all States and Union Territories have registered a lower figure compared to the previous decade.
- The percentage decadal growth rates of the six most populous States, namely, Uttar Pradesh, Maharashtra, Bihar, West Bengal, Andhra Pradesh and Madhya Pradesh have all fallen during 2001-2011 compared to 1991-2001.
Causes of Declining Growth Rate
- In 1952, India was the first country in the world to launch a national programme, emphasizing family planning to the extent necessary for reducing birth rates to stabilize the population at a level consistent with the requirement of national economy.
- Increased awareness and standard of living with emphasis on education has certainly helped in declining the population growth rate.
- Different population policies aiming at population development rather than punitive action has helped India to reduce its growth rate.
Demographic Transition
- Demographic transition theory (DTT) can be used to describe and predict the future population of any area.
- The theory tells us that population of any region changes from high births and high deaths to low births and low deaths as society progresses from rural agrarian and illiterate to urban industrial and literate society. These changes occur in stages which are collectively known as the demographic cycle.
- The first stage has high fertility and high mortality because people reproduce more to compensate for the deaths due to epidemics and variable food supply. The population growth is slow and most of the people are engaged in agriculture where large families are an asset. Life expectancy is low, people are mostly illiterate and have low levels of technology. Two hundred years ago all the countries of the world were in this stage.
- Fertility remains high in the beginning of second stage but it declines with time. This is accompanied by reduced mortality rate. Improvements in sanitation and health conditions lead to decline in mortality. Because of this gap the net addition to population is high.
- In the last stage, both fertility and mortality decline considerably. The population is either stable or grows slowly. The population becomes urbanised, literate and has high technical know- how and deliberately controls the family size.
- This shows that human beings are extremely flexible and are able to adjust their fertility.
- In the present day, different countries are at different stages of demographic transition.
Demographic Transition Theory
New National Population Policy (2000)
- The national population policy (NPP) affirms the commitment of government towards voluntary consent of citizens, while availing of reproductive health care services.
- The new national population policy (NPP) provides a policy frame work to meet the reproductive and child health needs of the people of India for the next 10 years.
- To achieve zero growth rate of population by 2045.
- To reduce infant mortality rate below 30 per thousand live birth by 2010.
- To reduce birth rate to 21 per thousand by 2010
- To reduce total fertility rate to 1 by 2010
- It is estimated that the population of India will be 126.4 crore by 2016.
- A National Commission on Population Under the chairmanship of Prime Minister, all CMs, selected union ministers, NGO & experts to oversee the implementation. (Although appears defunct body).
- Population Stabilization Fund (2005): An autonomous body, chaired by Health Minister, for awareness generation, community participation, mobilising fiscal donations etc. Known for 2 schemes:
- Prerna Scheme (for encouraging delayed marriage, childbirth and spacing. ASHA workers will give counselling to couples, provide contraceptives etc)
- Santushti Scheme (Public Private Partnership for sterilization services)
Critical Assessment of India’s Population Policy
India’s national population policies have failed to achieve their objectives as we remain world’s second largest populated country. The population of India in 1951 was 35 crore, but by 2011, it had increased to 121 crore. There have been few shortcomings.
- The NPP have a narrow perspective, give much importance to contraception and sterilisation. The basic prerequisite of meaningfully controlling population include poverty alleviation, improving the standards of living and the spread of education.
- On national scale the policy was not publicised and failed to generate mass support in favour of population control.
- We have insufficient infrastructure owing to the lack of trained staff, lack of adequate aptitude among the staff and limited use or misuse of the equipment for population control resulted in failure of the policy.
The use of coercion during the Emergency (1976-77) caused a serious resentment among the masses. This made the very NPP itself.
Implications of Population Growth
- India is not growing uniformly. The latest National Family Health Survey (NFHS) indicates that the Total Fertility Rate (TFR) varies significantly across various wealth Groups:
- The poorest wealth quintile has a TFR of 3.2 children per woman.
- The second lowest wealth quintile has a TFR of 2.5 children per woman.
- The richest wealth quintile has a TFR of 1.5 children per woman.
- This shows that population growth is more concentrated in economically weaker sections of society.
- Population growth acts as a hurdle in addressing effectively the problem of poverty, hunger and malnutrition and also in providing the better quality of health and education.
- SDGs 1, 2, 3 and 4 (Goal 1: No Poverty, Goal 2: Zero Hunger, Goal 3: Good Health and Well-being, Goal 4: Quality Education) are going to be affected adversely because of India’s existing pattern of growth in the population.
- Presently, India is producing around 25 million job seekers in the country, however, the country is able to provide jobs only to 7 million. This gap of 18 million is increasing the burden of unemployment and underemployment in the country, turning a demographic dividend into a demographic disaster.
- India’s population growth is not sustainable. India is only about 35-40% of China’s landmass.
- In the 19th century, when Europe had a demographic explosion, it had occupied America, Australia etc. India does not have another landmass to occupy and the available landmass cannot take this population growth.
Population Composition
Rural – Urban Composition
- According to The World Bank, urban population in India is 34% of total population
- The 2018 Revision of World Urbanization Prospects, released by the UN Department of Economic and Social Affairs, projects India’s urban population to rise to 52.8% in 2050.
- India has 640,867 villages according to the Census 2011 out of which 597,608 (93.2 per cent) are inhabited.
- A thorough examination of the pattern of distribution of rural population of India reveals that both at intra-State and inter- State levels, the relative degree of urbanization and extent of rural-urban migration regulate the concentration of rural population.
- The distribution of rural population is not uniform throughout the country.
- The states like Bihar and Sikkim have very high percentage of rural population.
- The states of Goa and Maharashtra have only little over half of their total population residing in villages.
Rural-Urban Composition, Census 2011
- The rural-urban migration is conspicuous in the case of urban areas along the main road links and railroads in the North Indian Plains, the industrial areas around Kolkata, Mumbai, Bengaluru – Mysuru, Madurai – Coimbatore, Ahmedabad – Surat, Delhi – Kanpur and Ludhiana – Jalandhar
Linguistic Composition
- India is a land of linguistic diversity. According to Registrar General and Census Commissioner of India the number of raw returns of mother tongues has totaled 19,569 in the report of the 2011 census.
- However, 71 per cent of the population in the country have one of the 22 scheduled languages as their mother tongue.
- Among the scheduled languages, the speakers of Hindi have the highest percentage.
- The smallest language groups are Kashmiri and Sanskrit speakers.
- It is noticed that the linguistic regions in the country do not maintain a sharp and distinct boundary.
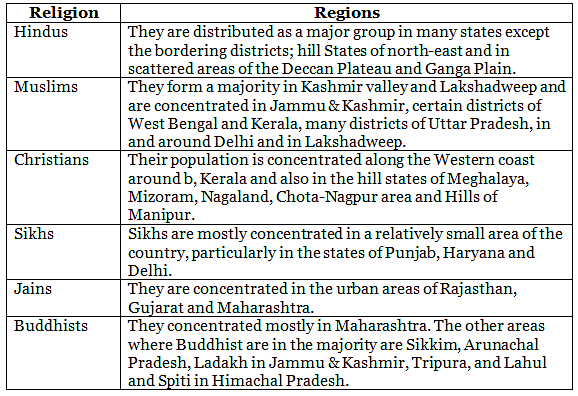
Religious Composition
- The Religious Composition reflects the distribution of total population by six major religious communities, namely, Hindu, Muslim, Christian, Sikh, Buddhist, Jain.
Occupational Composition
- According to the economic status the population of India is divided into three groups:
- Main workers: Main Worker is a person who works for at least 183 days (or six months) in a year.
- Marginal workers: Marginal Worker is a person who works for less than 183 days (or six months) in a year.
- Non-workers: They belong to an unemployed bunch of the population.
- In India, the proportion of workers (both main and marginal) is only 37.5% (Periodic Labour Force Survey 2018- 19) leaving a vast majority of about 60% as non-workers.
- It varies from about 39.6 in Goa to about 49.9% in Daman and Diu.
- This indicates an economic status in which there is a larger proportion of dependent population, further indicating possible existence of large number of unemployed or under employed people.
- In the context of a country like India, the work participation rate tends to be higher in the areas of lower levels of economic development since number of manual workers are needed to perform the subsistence or near subsistence economic activities.
- As far as the occupation of country’s male and female population is concerned, male workers out-number female workers in all the three sectors that is primary, secondary and tertiary.
- The number of female workers is relatively high in primary sector, though in recent years there has been some improvement in work participation of women in secondary and tertiary sectors.
- It is important to note that the proportion of workers in agricultural sector in India has shown a decline over the last few decades (58.2% in 2001 to 54.6% in 2011). Consequently, the participation rate in secondary and tertiary sector has registered an increase.
Sex Ratio
- The number of females per thousand males is referred to as sex ratio.
- According to the 2011 census, the sex ratio in India is 940 which was 933 in 2001.
- Kerala is the only state where the number of females is more than that of males. It has sex ratio of 1084.
- Haryana lies at the bottom with 879 females per thousand males.
- Among UTs, Puducherry has the highest (1037) sex ratio and Daman Diu has the lowest (618).
- Three major states, i.e., J&K, Bihar and Gujarat have shown decline in the sex ratio as compared to census 2001.
Child Sex Ratio
- The Child Sex Ratio in India is defined as the number of females per thousand males in the age group of 0–6 years in the human population.
- According to Census 2011, Child Sex Ratio in India is 918 which is lowest since Independence.
- Punjab, Haryana, Himachal Pradesh, Gujarat, Tamil Nadu, Mizoram, and Andaman and Nicobar Islands are observing an increasing trend in the Child Sex Ratio.
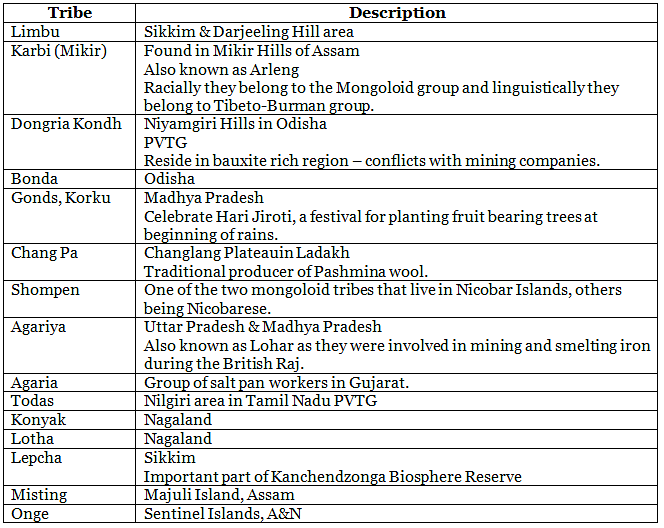
Tribes & Racial Groups
- In India, tribal population makes up for 8.6% of the total population and is found in all the states and UTs except Punjab and Haryana.
- Most of the tribes in India are concentrated in Central India, North eastern India and South Indian hills.
- Tribal communities in India are often identified by some specific signs such as primitive traits, distinctive culture, geographical isolation, shyness to contact with the community at large, and backwardness.
- Along with these, some tribal groups have some specific features such as:
- Dependency on hunting, gathering for food,
- Having primitive level of technology,
- Zero or negative growth of population,
- Extremely low level of literacy.
Particularly Vulnerable Tribal Groups
- In 1973, the Dhebar Commission created Primitive Tribal Groups (PTGs) as a separate category, who are less developed among the tribal groups. In 2006, the Government of India renamed the PTGs as PVTGs.
- In this context, in 1975, the Government of India initiated to identify the most vulnerable tribal groups as a separate category called PVTGs and declared 52 such groups, while in 1993 an additional 23 groups were added to the category, making it a total of 75 PVTGs out of 705 Scheduled Tribes.
- PVTGs are more vulnerable among the tribal groups. Due to this factor, more developed and assertive tribal groups take a major chunk of the tribal development funds because of which PVTGs need more funds directed for their development.
- PVTGs have some basic characteristics –
- they are mostly homogenous, with a small declining or stagnant population,
- they are relatively physically isolated,
- absence of written language,
- pre agricultural level of technology and a slower rate of change etc.
- Among the 75 listed PVTG’s the highest number are found in Odisha.
Women Empowerment And Population Growth
- Women are at times financially weak to pay for needed family planning and health services. Access to and control over productive resources will result in increased voice, agency and meaningful participation in decision-making at all levels from family planning to the time of conceiving.
- The failure of family planning is directly related to large-scale illiteracy that also contributes to the early age of marriage, low status of women, high child-mortality rate etc. They are least aware of the various ways to control population, usage of contraceptives and birth control measures.
- Uneducated families cannot grasp the issues and problems caused by the increasing population rate. Education has a transformative impact on girls. Educated girls tend to work more, earn more, expand their horizons, marry and start having children later with fewer children.
- Fertility rates are high because of misinformation about side-effects of contraceptives, lack of knowledge about the benefits of small families, and religious or male opposition to contraception.
- Any woman with multiple children spends most of her life as a mother and wife. She cannot play any meaningful role in her community and society until she is able to limit her family to a proper size. Family planning will not only improve family welfare but also contribute to achieving social prosperity and personal happiness.
- It is also crucial to sensitize men and boys at a young age, so they become an integral part in bringing about a transformation of women empowerment in Indian society. When men start respecting women and accepting them as equals, a lot of gender-based inequalities will reduce considerably.
Demographic Dividend
- According to United Nations Population Fund (UNFPA), demographic dividend means, “the economic growth potential that can result from shifts in a population’s age structure, mainly when the share of the working-age population (15 to 64) is larger than the non-working-age share of the population (14 and younger, and 65 and older)”.
- India has 5% of its population in the age group of 15-59 years which is ever increasing and will be at the peak around 2036 when it will reach approximately 65%.
Challenges Associated with Demographic Dividend
- Asymmetric demography: The growth in the working-age ratio is likely to be concentrated in some of India’s poorest states and the demographic dividend will be fully realized only if India is able to create gainful employment opportunities for this working-age population.
- Lack of skills: Most of the new jobs that will be created in the future will be highly skilled and lack of skill in Indian workforce is a major challenge. India may not be able to take advantage of the opportunities, due to a low human capital base and lack of skills.
- Low human development parameters: India ranks 130 out of 189 countries in UNDP’s Human Development Index, which is alarming. Therefore, health and education parameters need to be improved substantially to make the Indian workforce efficient and skilled.
- Informal nature of economy in India is another hurdle in reaping the benefits of demographic transition in India.
- Jobless growth– There is mounting concern that future growth could turn out to be jobless due to de-industrialization, de-globalization, the fourth industrial revolution and technological progress. As per the NSSO Periodic Labor Force Survey 2017-18, India’s labor force participation rate for the age-group 15-59 years is around 53%, that is, around half of the working age population is jobless.
What needs to be done?
- Building human capital:Investing in people through healthcare, quality education, jobs and skills helps build human capital, which is key to supporting economic growth, ending extreme poverty, and creating a more inclusive society.
- Skill developmentto increase employability of young population. India’s labour force needs to be empowered with the right skills for the modern economy. Government has established the National Skill Development Corporation (NSDC) with the overall target of skilling/ up skilling 500 million people in India by 2022.
- Education:Enhancing educational levels by properly investing in primary, secondary and higher education. India, which has almost 41% of population below the age of 20 years, can reap the demographic dividend only if with a better education system. Also, academic-industry collaboration is necessary to synchronise modern industry demands and learning levels in academics. Establishment of Higher Education Finance Agency (HEFA) is a welcome step in this direction.
- Health:Improvement in healthcare infrastructure would ensure higher number of productive days for young labour force, thus increasing the productivity of the economy.
Success of schemes like Ayushman Bharat and National Health Protection scheme (NHPS) is necessary. Also, nutrition level in women and children needs special care with effective implementation of Integrated Child Development (ICDS) programme. - Job Creation:The nation needs to create ten million jobs per year to absorb the addition of young people into the workforce. Promoting businesses’ interests and entrepreneurship would help in job creation to provide employment to the large labour force.
- India’s improved ranking in the World Bank’s Ease of Doing Business Indexis a good sign.
- Schemes like Start-up Indiaand Make in India, if implemented properly, would bring the desired result in the near future.
- Urbanisation:The large young and working population in the years to come will migrate to urban areas within their own and other States, leading to rapid and large-scale increase in urban population. How these migrating people can have access to basic amenities, health and social services in urban areas need to be the focus of urban policy planning.
Suggestive measures for population control
Measures for population control
- Social Measures
- Economic Measure
- Other Measures
Social Measures
- Minimum age of Marriage à In India minimum age for marriage is 21 years for men and 18 years for women has been fixed by law. As fertility depends on the age of marriage, this law should be firmly implemented and people should also be made aware of this through publicity.
- Raising the Status of Women à There is still discrimination to the women. So women should be given opportunities to develop socially and economically. Free education should be given to them.
- Spread of Education à The spread of education changes the outlook of people. The educated men prefer to delay marriage and adopt small family norms. Educated women are health conscious and avoid frequent pregnancies and thus help in lowering birth rate.
- Adoption à Some parents do not have any child, despite costly medical treatment. It is advisable that they should adopt orphan children.
- Change in Social Outlook à Marriage should no longer be considered a social binding. Issueless women should not be looked down upon.
- Social Security à More and more people should be covered under-social security schemes. So that they do not depend upon others in the event of old age, sickness, unemployment etc..
Economic Measures
- More employment opportunities à The first and foremost measure is to raise the employment avenues in rural as well as urban areas. (Generally in rural areas there is disguised unemployment).
- Development of Agriculture and Industry à If agriculture and industry are properly developed, large number of people will get employment. When their income is increased they would improve their standard of living and adopt small family norms.
- Standard of Living à Improved standard of living acts as a deterrent to large family norm. In order to maintain their higher standard of living, people prefer to have a small family.
- Urbanisation à It is on record that people in urban areas have low birth rate than those living in rural areas.
Other Measures
- Late Marriage à This will reduce the period of reproduction among the females bringing down the birth rate.
- Family Planning à This method implies family by choice and not by chance. By applying preventive measures, people can regulate birth rate. The success of this method depends on the availability of cheap contraceptive devices for birth control.
- Publicity à The communication media like TV, radio and newspaper are the good means to propagate the benefits of the planned family to the uneducated and illiterate people especially in the rural and backward areas of the country.
- Incentives à The govt. can give various types of incentives to the people to adopt birth control measures. Monetary incentives and other facilities like leave and promotion can be extended to the working class which adopts small family norms.
- Employment to Woman à The female labour force participation has had a decadal fall from 36.7 per cent in 2005 to 26 per cent in 2018, with 95% (195 million) women employed in the unorganised sector according to a report by Deloitte. Access to quality education, reducing the digital divide, mentoring adolescent girls on vocational training and apprenticeship avenues can build a strong linkage towards considering technology linked training and employment options.
Mission Parivar Vikas
- The Ministry of Health and Family Welfare has launched “Mission Parivar Vikas” in 145 high focus districts having the highest total fertility rates in the country.
- The main objective of ‘Mission Parivar Vikas’ will be to accelerate access to high quality family planning choices based on information, reliable services and supplies within a rights-based framework.
- These 145 districts are in the seven high focus, high TFR states of Uttar Pradesh, Bihar, Rajasthan, Madhya Pradesh, Chhattisgarh, Jharkhand and Assam that constitute 44% of the country’s population.
- The key strategic focus of this initiative will be on improving access to contraceptives through delivering assured services, dovetailing with new promotional schemes, ensuring commodity security, building capacity (service providers), creating an enabling environment along with close monitoring and implementation.
The Population Pyramid (The Age-Sex Pyramid)
- The age-sex structure of a population refers to the number of females and males in different age groups.
- A population pyramid is used to show the age-sex structure of the population. The shape of the population pyramid reflects the characteristics of the population.
- The male and female populations are broken down into 5-year age groups represented as horizontal bars along the vertical axis, with the youngest age groups at the bottom and the oldest at the top.
The shape of the population pyramid gradually evolves over time based on fertility, mortality, and international migration trends.
Expanding Population
- The age-sex pyramid in such a case is a triangular-shaped pyramid with a wide base and is typical of less developed countries.
- These have larger populations in lower age groups due to high birth rates.
Constant Population
- Here, the age-sex pyramid is bell-shaped and tapered towards the top.
- This shows birth and death rates are almost equal leading to a near-constant population.
Declining Population
- This pyramid has a narrow base and a tapered top showing low birth and death rates.
- The population growth in developed countries is usually zero or negative.
Malthus’ Theory of Population Growth
- Malthus contended that the world’s population was growing more rapidly than the available food supply.
- He argued that the food supply increases in an arithmetic progression (1, 2, 3, 4, and so on), whereas the population expands by a geometric progression (1, 2, 4, 8, and so on).
- According to him, the population could increase by multiples, doubling every twenty-five years. The gap between the food supply and the population will continue to grow over time. Even though the food supply will increase, it would be insufficient to meet the needs of an expanding population. Moreover, famine and other natural calamities cause widespread sufferings and increase the death rate, which is nature’s check against the population.
- Unfortunately, humanity has only a limited ability to voluntarily reduce the growth of its population (through ‘preventive checks’ such as postponing marriage or practicing sexual abstinence or celibacy). Malthus believed ‘positive checks’ to population growth in the form of famines and diseases.
- Nature has its own ways of keeping a check on the increasing population. It brings the population level to the level of the available food supply. The positive checks include famines, earthquakes, floods, epidemics, wars, etc. When humans fail to control excessive population growth, nature plays its role.
Marx’s Response To Malthus’ Thesis
- Karl Marx went one step further and argued that starvation was caused by the unequal distribution of wealth and its accumulation by capitalists. It has nothing to do with the population.
- The population is dependent on economic and social organization. The problems of overpopulation and limits to resources, as enunciated by Malthus, are inherent and inevitable features associated with the capitalist system of production.
- He does not believe in natural laws controlling the population. According to him, capitalism created population growth in order to create a vast pool of cheap labor.
Some Reports
State of World Population 2019
- It is released by United Nations Population Fund (UNFPA)
- India accounts for over one-sixth of the world’s population in 2019 (1.37 billion out of 7.71 billion).
- It has grown at a rate (2% per year between 2010 and 2019) that is just over the world growth rate (1.2%).
- India’s life expectancy at birth is lower than the world’s (69 years to 72).
- It scores higher than the global average in terms of access to healthcare during childbirth, and also has a much lower adolescent birth rate.
- India’s maternal mortality ratio in 2015 was 174 deaths per lakh live births (down from 448 in 1994) while the global MMR in 2015 was 216.
- India’s fertility rate in 2019 is 2.3 births per woman, compared to 2.5 worldwide.
World Population Prospects 2019
- The United Nations released the ‘World Population Projections 2019′ report.
- India is projected to surpass China as the world’s most populous country in the next 8 years i.e. by around 2027.
- India is expected to add nearly 273 million people between 2019 and 2050.
- It will remain the most populated country through the end of the current century.
- Together, the population of India and Nigeria (projected to grow by 200 million) could account for 23% of the global population increase to 2050.
- Over-65 population – In India, children under age five still outnumber the over-65 population.
- But the over-65 population is projected to overtake the under-five group between 2025 and 2030.
- By 2050, persons over age 65 will make up about one-seventh of India’s population.
- By then, the 15-24 years age group in India (13.8%), too, will outnumber the over-65 group (13.6%).
- So, children under age five are projected to constitute less than 6% of India’s population in 2050, as compared to 7% globally.
NITI Aayog to draft roadmap for achieving population stabilization
- NITI Aayog is organising a National Consultation titled “Realizing the vision of population stabilization: leaving no one behind”.
- The working paper is expected to address key gaps in India’s family planning programmes.
- It will offer constructive recommendations to address regional disparities in outcomes by focusing on adolescents and youths, inter-departmental convergence, demand generation, access to contraceptive services and quality of care.
- The recommendations from the consultation will contribute to a NITI Aayog working paper to help achieve India’s vision of attaining population stabilization.
Key recommendations expected to emerge from the meeting are as follows:
- Increasing the basket of contraceptive choices, with greater focus on spacing methods and helping women make informed choices about delaying pregnancy and spacing between children.
- Addressing social determinants of health such as age at marriage and sex-selective practices.
- Strengthening quality of care, including counseling services, managing side effects and family planning support.
- Increasing budgetary allocations for family planning, to align with the unmet needs of India’s young people who constitute nearly 30 per cent of our population
- Addressing existing socio-cultural barriers towards contraception by investing extensively in innovative behaviour-change communication strategies.
- Treating population stabilization and family planning as a national priority, fostering inter-departmental convergence and ensuring multisectoral participation and integration.
Why such move?
- India, with a current population size of 1.37 billion, has the second largest population in the world.
- Family planning is considered universally as the smartest development investment.
- For India to realize its sustainable development goals and economic aspirations, it is important to ensure that people have informed access to contraception and quality family planning services.
- India is also at a stage where birth rates are falling but the population continues to grow due to the fact that more than 30 % of the population is young and in the reproductive age group.
- Nearly 30 million currently married women in the age group of 15-49 years within this critical cohort have unmet needs in family planning.
- This limits their ability to delay or avoid pregnancy by not having access or the agency to use contraception.
Jansankhya Sthirata Kosh (Jsk)
- Jansankhya Sthirata Kosh (JSK) an autonomous body under Ministry of Health and Family Welfare, implemented the following schemes:
- Prerna Scheme (for delaying marriage, childbirth and spacing),
- Santushti Scheme (Public Private Partnership for sterilization services), and
- National Helpline (for information on family planning).
- Jansankhya Sthirata Kosh (JSK) is a registered society of the Ministry of Health and Family Welfare started with a Rs 100 crore grant from government.
- The society was established with the objective of highlighting the need for population stabilization. Its accounts can be audited by the CAG.
- The “Jansankhya Sthirata Kosh” (JSK) (National Population Stabilisation Fund) has been registered as an autonomous Society established under the Societies Registration Act of 1860.
- JSK has to promote and undertake activities aimed at achieving population stabilisation at a level consistent with the needs of sustainable economic growth, social development and environment protection, by 2045.
United Nations Population Fund (UNFPA)
- It is a subsidiary organ of the United Nations General Assembly (UNGA) and works as a sexual and reproductive health agency.
- It was established as a trust fund in 1967and began operations in 1969.
- In 1987, it was officially renamed the United Nations Population Fund but the original abbreviation, ‘UNFPA’for the United Nations Fund for Population Activities was retained.
- The UN Economic and Social Council (ECOSOC) establishes its mandate.
- UNFPA is not supported by the UN budget, instead, it is entirely supported by voluntary contributions of donor governments, intergovernmental organizations, the private sector, foundations and individuals.
- UNFPA works directly to tackleon health (SDG3), education (SDG4) and gender equality (SDG5).
- India can achieve a number of SDGs if it links them with family planning.
|
541 videos|683 docs|263 tests
|
FAQs on Population - IBPS PO Prelims & Mains Preparation - Bank Exams
| 1. What is the demographic transition theory? |  |
| 2. How does the demographic transition theory explain population dynamics? | |
| 3. What are the factors that influence the demographic transition? | |
| 4. How does the demographic transition theory impact societies? | |
| 5. Are there any criticisms of the demographic transition theory? | |

|
1.7K Views |

|
4.61/5 Rating |

|
Dec 22, 2024 Last updated |
|
541 videos|683 docs|263 tests
|

|
Explore Courses for Bank Exams exam
|
|
MCQs
,Sample Paper
,study material
,Population | IBPS PO Prelims & Mains Preparation - Bank Exams
,shortcuts and tricks
,Summary
,past year papers
,mock tests for examination
,video lectures
,Extra Questions
,practice quizzes
,Important questions
,Free
,Population | IBPS PO Prelims & Mains Preparation - Bank Exams
,Previous Year Questions with Solutions
,Exam
,Population | IBPS PO Prelims & Mains Preparation - Bank Exams
,Viva Questions
,Semester Notes
,Objective type Questions
,ppt
;


Population Free PDF Download
Importance of Population
Population Notes
Population Bank Exams Questions
Study Population on the App
|
© EduRev
|
Education Revolution
|


|


