Class 8 Exam  >  Class 8 Notes  >  Mathematics (Maths) Class 8  >  Points to Remember- Introduction to Graphs

Points to Remember- Introduction to Graphs | Mathematics (Maths) Class 8 PDF Download

Points to Remember 

  • Pictorial and graphical representation are easier to understand.
  • A line graph displays data that change continuously over periods of time.
  • "Linear graph" refers to a line graph that consists of an unbroken line.
  • To fix a point on the graph paper, we require both the x-coordinate and the y-coordinate. 
  • The horizontal line of the axes is called the x-axis (x-coordinate)and the vertical line is called the y-axis (y-coordinate).

The Relationship between the Independent and Dependent Variable
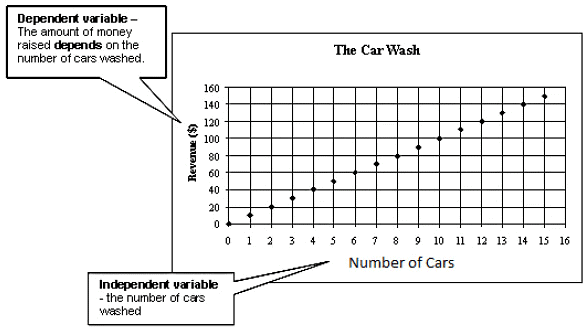
Points to Remember- Introduction to Graphs | Mathematics (Maths) Class 8

We  Know That

  • The purpose of drawing a graph is to show numerical values in the usual form so they can be understood quickly, easily and clearly. 
  • We also know that a bar graph is used to show a comparison among categories. 
  • A bar graph may consists of two or more parallel horizontal or vertical bars of equal width.
  • A pie-graph is used to compare various parts of a whole using a circle
  • A histogram is a bar-graph that shows data in intervals. It has adjacent bars over the intervals as shown below.
  • A line-graph is called a linear-graph and it displays data that changes continuously over periods of time.
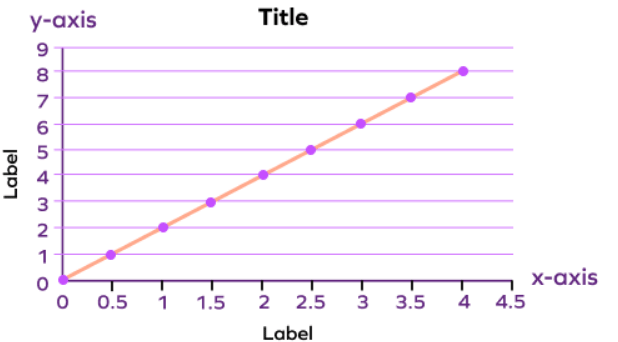
Linear GraphLinear Graph

Question for Points to Remember- Introduction to Graphs
Try yourself:
Which type of graph is used to show a comparison among categories?
View Solution

Solved Example:
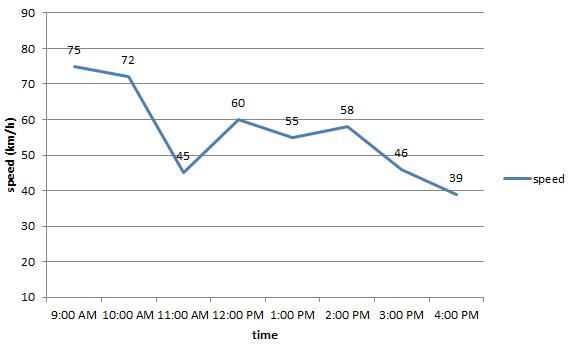
Q 1.  From the given line graph answer the following questions
Points to Remember- Introduction to Graphs | Mathematics (Maths) Class 8

What was the speed of the car at 1:00 PM?
Find the difference in the speed of the car for the time 10 AM and 11 AM?
What are the maximum and the minimum speed of the car?
Ans:
From the line graph,
The speed of the car is 55 km/h.
The difference in speed of the car = (72 − 45) km/h = 27 km/h.
The maximum speed = 75 km/h and the minimum speed = 39 km/h.

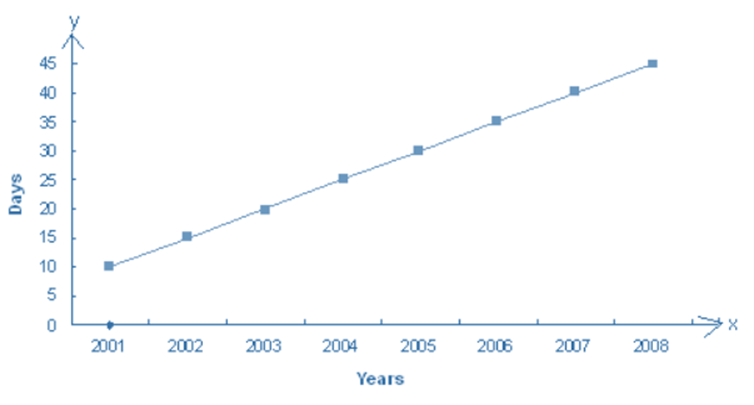
Q 2. Use the table below to draw a linear graphs

The number of days a city received a rainfall in different years

YEAR

2001

2002

2003

2004

2005

2006

2007

2008

DAYS

10

15

20

25

30

35

40

45

Ans : Points to Remember- Introduction to Graphs | Mathematics (Maths) Class 8

Question for Points to Remember- Introduction to Graphs
Try yourself:
In the given table, what was the number of days the city received rainfall in the year 2006?
View Solution

The document Points to Remember- Introduction to Graphs | Mathematics (Maths) Class 8 is a part of the Class 8 Course Mathematics (Maths) Class 8.
All you need of Class 8 at this link: Class 8
79 videos|408 docs|31 tests

Top Courses for Class 8

FAQs on Points to Remember- Introduction to Graphs - Mathematics (Maths) Class 8

1. What is a graph in mathematics?
Ans. A graph in mathematics is a visual representation of data that consists of nodes (or vertices) connected by edges (or lines). It is used to illustrate relationships between different elements, making it easier to analyze and interpret complex information.
2. What are the different types of graphs?
Ans. There are several types of graphs, including: 1. <b>Bar Graphs</b> - used to compare quantities across different categories. 2. <b>Line Graphs</b> - used to show trends over time by connecting data points with lines. 3. <b>Pie Charts</b> - used to represent parts of a whole, showing the percentage of each category. 4. <b>Scatter Plots</b> - used to display values for typically two variables for a set of data.
3. How do you read a graph effectively?
Ans. To read a graph effectively, start by identifying the axes and their labels to understand what data is being represented. Look for trends, patterns, and outliers in the data points. Also, pay attention to the scale used on the axes to avoid misinterpretation of the data.
4. Why are graphs important in data analysis?
Ans. Graphs are important in data analysis because they simplify complex data sets, making it easier to identify trends, patterns, and relationships. They allow for quick comparisons and can highlight significant changes over time, aiding decision-making processes.
5. What are some common mistakes to avoid when creating graphs?
Ans. Common mistakes to avoid when creating graphs include: 1. Using an inappropriate graph type for the data. 2. Mislabeling axes or omitting units. 3. Choosing misleading scales that distort the data. 4. Cluttering the graph with unnecessary information that can confuse the viewer.
79 videos|408 docs|31 tests
Download as PDF
Explore Courses for Class 8 exam

Top Courses for Class 8

Signup for Free!
Signup to see your scores go up within 7 days! Learn & Practice with 1000+ FREE Notes, Videos & Tests.
10M+ students study on EduRev
Related Searches

Free

,

Viva Questions

,

Points to Remember- Introduction to Graphs | Mathematics (Maths) Class 8

,

Extra Questions

,

Summary

,

Points to Remember- Introduction to Graphs | Mathematics (Maths) Class 8

,

pdf

,

ppt

,

Important questions

,

Semester Notes

,

Sample Paper

,

past year papers

,

video lectures

,

Objective type Questions

,

Exam

,

practice quizzes

,

Previous Year Questions with Solutions

,

Points to Remember- Introduction to Graphs | Mathematics (Maths) Class 8

,

mock tests for examination

,

study material

,

shortcuts and tricks

,

MCQs

;