Class 8 Exam  >  Class 8 Notes  >  Mathematics (Maths) Class 8  >  Important Questions: Introduction to Graphs

Class 8 Maths Chapter 13 Important Question Answers - Introduction to Graphs

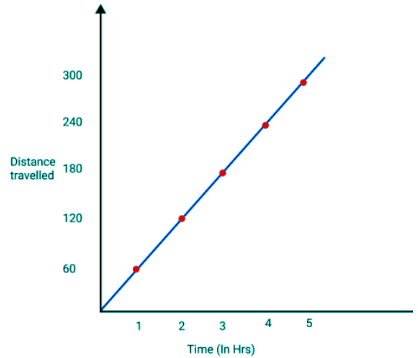
Q1: A train is moving at a constant speed of 60kmh1. Draw a distance - time graph
(a) How far will it travel in 22 hours 3030 minutes
(b) Find the time required to cover a distance of 260km.
Sol: 
Speed of train = 60km/hr
Table for distance - time graph is as follows:

Class 8 Maths Chapter 13 Important Question Answers - Introduction to Graphs

Scale:
On x axis 1cm=1hr
On y axis 1cm = 60km
(a) Distance covered in 22 hours 3030 minutes 150km
(b) Time required to cover a distance of 260km 4.332

Class 8 Maths Chapter 13 Important Question Answers - Introduction to Graphs


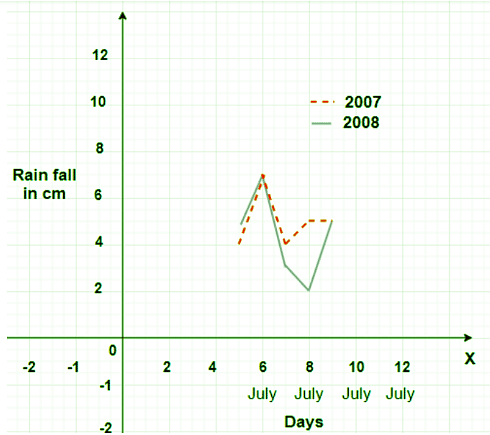
Q2: Study the following graph and answer the following questions
Class 8 Maths Chapter 13 Important Question Answers - Introduction to Graphs

Sol:
(a) Which year has better rainfall?
Ans: 2007
(b) On how many days the rainfall was same?
Ans: For 8th July and 9th July of 2007 the rainfall was same.
(c) Name the only date on which 20082008 got more rainfall?
Ans: On 6n July of 2008 rainfall is max (7cm)
(d) On which date the difference between the rainfall of the 2 years was biggest?
Ans: 8hy July
(e) What is the difference between the rainfall of 2007 and 2008 on July 8th?
Ans: 3cm of difference
On July 8th  in 2007=2007= Rainfall =5cm
On July 8th in 2008=2008= Rainfall =2cm
Difference  − 3cm


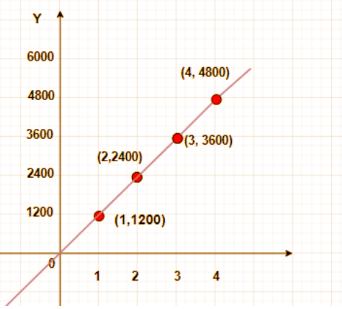
Q3:  Reena deposited Rs12,000in a bank at the rate of 10% per annum. Draw a linear graph showing the relationship between the time and simple interest. Also find the simple interest for 4 years.
Sol: 12,000
10%
Simple interest for one year = PTR / 100
= 12000 x 10/100 x 1
= 1200Class 8 Maths Chapter 13 Important Question Answers - Introduction to GraphsClass 8 Maths Chapter 13 Important Question Answers - Introduction to Graphs

Simple interest after 4  years is 4800.


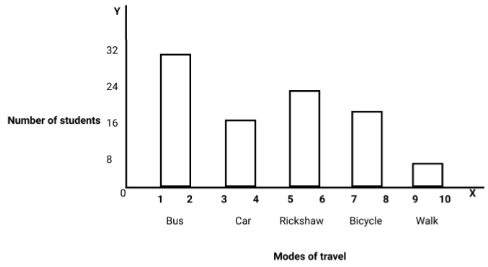
Q4: Hundred students from a certain locality use different modes of travelling to school as given below. Draw a bar graph which is maximum mode of travel?

Class 8 Maths Chapter 13 Important Question Answers - Introduction to Graphs

Sol: Scale: on x axis 1cm = 1 unit
On y axis 1cm=8 units

Class 8 Maths Chapter 13 Important Question Answers - Introduction to Graphs

Maximum mode of travel is bus.


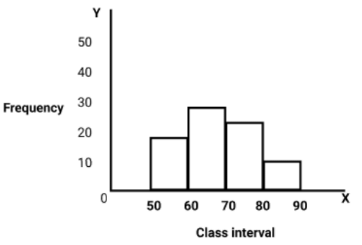
Q5: Draw the histogram to represent the following data and define linear graph.Class 8 Maths Chapter 13 Important Question Answers - Introduction to Graphs

Sol:

Class 8 Maths Chapter 13 Important Question Answers - Introduction to Graphs

A line graph which is a whole unbroken line is called a linear graph.


Q6: State true or false
(a) A point whose x−co-ordinates is zero and y− co-ordinates is non-zero will lie on the y−axis
(b) The co-ordinates of the origin are (0,0)
(c) A point whose y−co-ordinates is zero and x− co-ordinates is 4 will lie on the y−axis
Ans:

(a) True
(b) True
(c) False


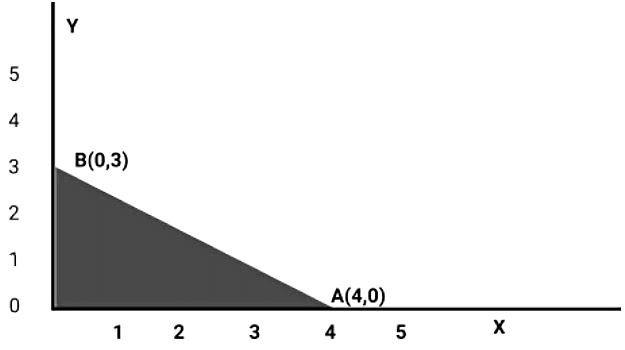
Q7: Plot the points A(4,0) and B(0,3) on the graph. Also find the length of hypotenuse of triangle AOB
Sol: Ox co-ordinate of point 4
OB yco-ordinate of point 

Class 8 Maths Chapter 13 Important Question Answers - Introduction to Graphs

Hypotenuse A42 + 32
A16 + 9
A25 
A5.


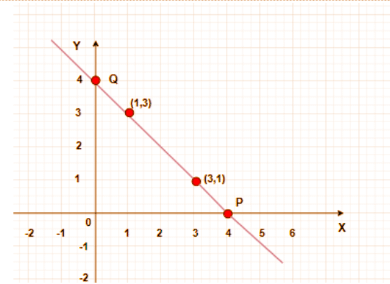
Q8: Draw a line passing through (3,1) and (1,3). Find the co-ordinates of the points at which this line meets the x− axis and y− axis.
Sol:
The co-ordinates of the point on x−  axis and y− axis is where the line meets axes.
Class 8 Maths Chapter 13 Important Question Answers - Introduction to Graphs

x−  axis, P = (4, 0)
y− axis, Q = (0, 4)


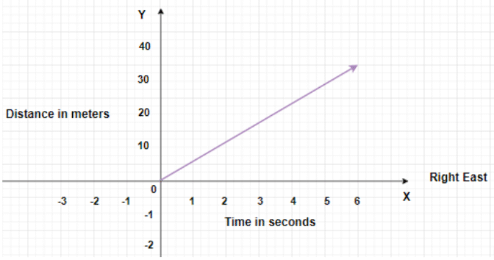
Q9: Find the time taken by a body to cover 30 meters. Hence find speed?
Class 8 Maths Chapter 13 Important Question Answers - Introduction to Graphs

Sol: Time taken to cover a distance of 30m = 6  seconds
Speed = Distance covered /  Time taken
Speed = 30m/6s
= 5ms-1


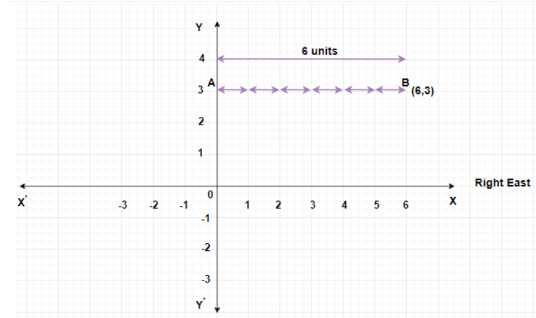
Q10: If a man moves 6 units right due (east) from point A, then find the co-ordinates of his new position.
Class 8 Maths Chapter 13 Important Question Answers - Introduction to Graphs

Sol: The position of point A = (3, 0)
If a man moves 6 units right from point A then new position of man will be at B = (6, 3).


Q11: What is a pie graph?
Ans: 
Data can be represented by dividing a circle into sectors. This type of representation of data is called a pic graph. It shows us the relation of parts to the whole.


Q12: Perpendicular distance of the point (23from x axis is
(a) 2
(b) 3
(c) 0
(d) None of these
Ans: (b)


Q13: The point where x− axis and y− axis meet is called __________?
Ans: 
Origin


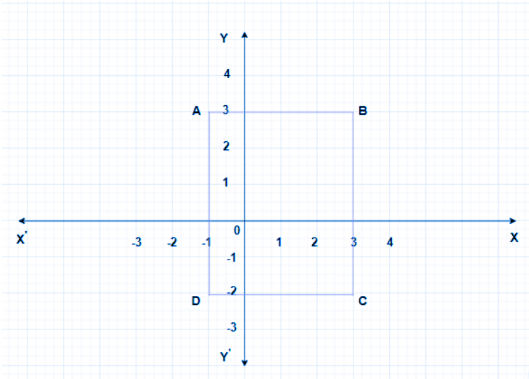
Q14: Find the co-ordinates of the points A, B, C, D from the graph.
Class 8 Maths Chapter 13 Important Question Answers - Introduction to Graphs

Sol: The co-ordinates of the point
A = (−1, 3)
B = (3, 3)
C = (−2, 3)
D = (−1, −2)


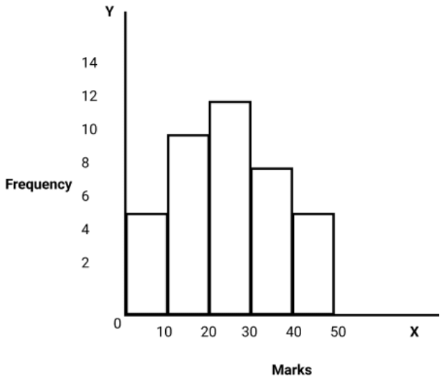
Q15: In a class of 40 students, the marks obtained in maths subject (out of 50) are as given below.

Class 8 Maths Chapter 13 Important Question Answers - Introduction to Graphs

Draw histogram?
Sol: 

Class 8 Maths Chapter 13 Important Question Answers - Introduction to Graphs

The document Class 8 Maths Chapter 13 Important Question Answers - Introduction to Graphs is a part of the Class 8 Course Mathematics (Maths) Class 8.
All you need of Class 8 at this link: Class 8
79 videos|408 docs|31 tests

Top Courses for Class 8

FAQs on Class 8 Maths Chapter 13 Important Question Answers - Introduction to Graphs

1. What is a graph in computer science?
Ans. In computer science, a graph is a data structure that consists of a set of nodes (vertices) and a set of edges connecting these nodes. It is used to represent relationships or connections between different entities.
2. What are the types of graphs commonly used in computer science?
Ans. There are several types of graphs commonly used in computer science, including: - Directed Graphs: Also known as digraphs, these graphs have directed edges, where the edges have a specific direction or orientation. - Undirected Graphs: In contrast to directed graphs, undirected graphs have edges that do not have any specific direction. - Weighted Graphs: These graphs have edges with weights or values associated with them, which represent the cost or distance between the nodes. - Bipartite Graphs: Bipartite graphs are graphs whose nodes can be divided into two disjoint sets such that there are no edges between nodes within the same set. - Cyclic Graphs: Cyclic graphs contain at least one cycle, meaning there is a path that starts and ends at the same node.
3. What is the difference between a graph and a tree?
Ans. While both graphs and trees are used to represent relationships between entities, there are some key differences between them. A tree is a special type of graph that is acyclic, meaning it does not contain any cycles or loops. Additionally, a tree has a designated root node from which all other nodes are reachable through a unique path. In contrast, a graph can have cycles and does not necessarily have a root node.
4. How are graphs represented in computer memory?
Ans. Graphs can be represented in computer memory using various data structures. One common representation is an adjacency matrix, which is a two-dimensional matrix where the rows and columns represent the nodes, and the values in the matrix indicate the presence or absence of edges between nodes. Another representation is an adjacency list, where each node is associated with a list of its neighboring nodes. This representation is more space-efficient for sparse graphs.
5. What are some common applications of graphs in computer science?
Ans. Graphs have numerous applications in computer science, including: - Social Networks: Graphs are used to model social networks, where nodes represent individuals or entities, and edges represent connections or relationships between them. - Routing and Network Analysis: Graphs are used to model networks, such as road networks or computer networks, to find optimal routes or analyze the connectivity between different nodes. - Web Page Ranking: Graphs are used in web page ranking algorithms, such as Google's PageRank, to determine the importance of web pages based on their connections to other pages. - Compiler Design: Graphs are used in compiler design to represent control flow graphs and data flow graphs, which help in optimizing and analyzing code. - Recommendation Systems: Graphs are used in recommendation systems to model user preferences and relationships between items, allowing for personalized recommendations.
79 videos|408 docs|31 tests
Download as PDF
Explore Courses for Class 8 exam

Top Courses for Class 8

Signup for Free!
Signup to see your scores go up within 7 days! Learn & Practice with 1000+ FREE Notes, Videos & Tests.
10M+ students study on EduRev
Related Searches

Previous Year Questions with Solutions

,

Free

,

past year papers

,

Extra Questions

,

MCQs

,

Important questions

,

pdf

,

Exam

,

Semester Notes

,

ppt

,

Objective type Questions

,

video lectures

,

Viva Questions

,

practice quizzes

,

study material

,

Sample Paper

,

shortcuts and tricks

,

Class 8 Maths Chapter 13 Important Question Answers - Introduction to Graphs

,

Summary

,

mock tests for examination

,

Class 8 Maths Chapter 13 Important Question Answers - Introduction to Graphs

,

Class 8 Maths Chapter 13 Important Question Answers - Introduction to Graphs

;