Points to Remember- Data Handling | Mathematics (Maths) Class 8 PDF Download
| Table of contents |

|
| What is Data Handling? |

|
| Facts That Matter |

|
| Pie Charts |

|
| We Know That |

|
What is Data Handling?
Data handling is referred to the procedure done to organize the information provided in order to perform mathematical operations on them.
- Raw Data: Raw data is also known as primary data which is available in an unorganized form.
- Organization of Raw Data: Raw data is unorganized. To draw meaningful inferences we organize data. There are various ways in which we can organize data. For example, we can organize raw data using a Frequency distribution table, Bar graphs, etc.
- Pictographs: A pictograph is the pictorial representation of data using symbols.
For example: If 10 Apples were sold in January, 40 were sold in February, 25 were sold in March, and 20 were sold in April. We can represent the given data as a pictograph as given below: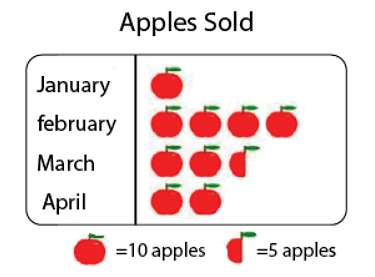
Scale Factor: The scale factor is the ratio of the length of a side of one figure to the length of the corresponding side of the other figure. The scale factor is used in making maps. The scale of a map is the ratio of a distance on the map to the corresponding distance on the ground.
- Bar Graphs: A bar graph is a representation of data using a rectangular bars that are having heights that are proportional to the values that are represented by them.
For Example: The bar graph below shows the sale of cars of various brands in the month of April - Multiple Bar Graphs: Multiple bar graphs is a bar graph which is used for comparing more than one kind of information.
Example: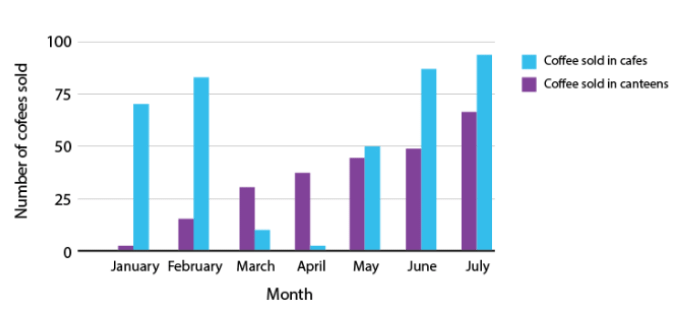 The above figure is a double bar graph. It shows the number of cup of coffees sold in cafes and canteens for the months January, February, March, April and May, June and July.
Facts That Matter
The numerical information is called data.- Data can be arranged and presented by grouped frequency distribution.
- Frequency is the number of times a particular entry occurs.
- Histogram is a special type of bar graph in which the class intervals are shown on the horizontal axis and heights of the bars correspond to the frequency of the class.
- In a histogram, there is no gap between bars.
- A circle graph or a pie chart shows the relationship between a whole and its parts.
- Outcomes of an event or experiment are equally likely if each has the same of occurring.
- Probability of an event =
- Probability of an event can have a value from 0 to 1.
- Probability of a sure event is 1.
- Probability of an impossible event is 0.
Pie Charts
A pie chart shows the relationship between a whole circle and its parts. The circle is divided into sectors. The size of each sector is proportional to the information it represents. Pie charts are also known as circle graphs.
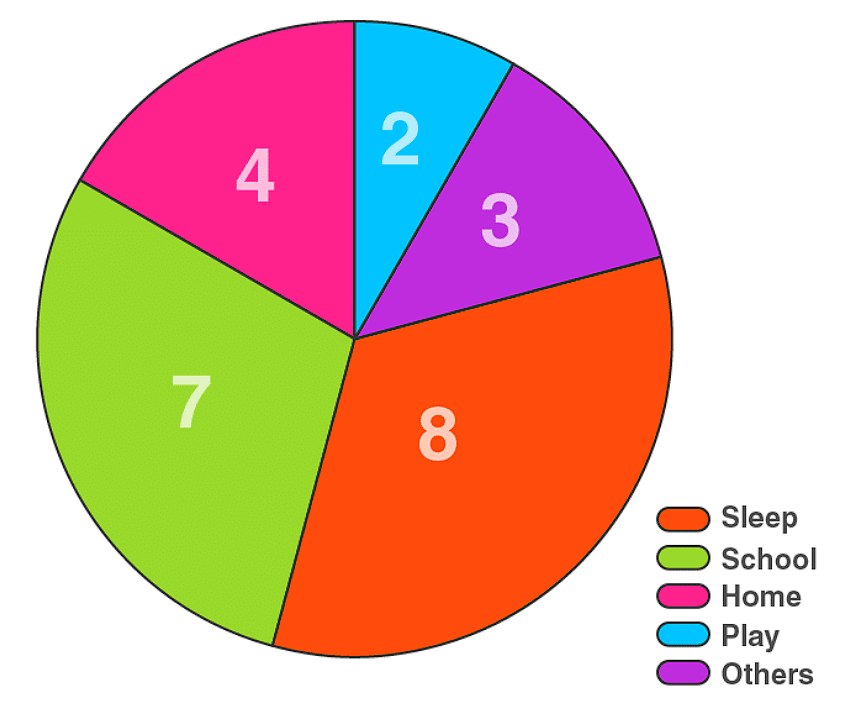
Creating Different Pie Charts
For creating a pie chart the following steps needs to be followed:
- For each list of item or activity calculate the fraction or part which it represents.
- Convert each fraction into degrees by multiplying it with 360∘.
- Draw a circle and divide it into sectors. The central angle of each sector is equal to the fraction of 360∘ as calculated above.
We Know That
Numerical information is called an observation. The collection of all these observations is called data. The collection of observation collected initially is called raw data. Raw data is tabulated in a precise manner. We may represent numerical data through pictures or graphs, which is called pictorial representation of the data. The pictorial representation of data using symbols is called pictograph. A display of information using bars of uniform width is called a bar-graph. In a bar-graph, the heights of bars are proportional to the respective values.
Solved Examples
Q1: The table gives the number of snacks ordered and the number of days as a tally. Find the frequency of snacks ordered.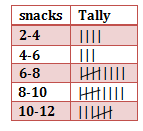
Solution: From the frequency table the number of snacks ordered ranging between
2-4 is 4 days
4 to 6 is 3 days
6 to 8 is 9 days
8 to 10 is 9 days
10 to 12 is 7 days.
So the frequencies for all snacks ordered are 4, 3, 9, 9, 7
Q2: The pictograph shows the number of eggs sold by a trader in three days. If the trader still had 115 eggs left after the three days, calculate the number of eggs he had at first.
a. 187
b. 425
c. 415
d. 98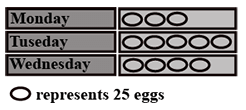
Solution: The correct answer is “C”. Eggs Sold on the three days
Monday : 3 X 25 = 75
Tuesday: 5 X 25 = 125
Wednesday: 4 X 25 = 100
Eggs remaining = 115
Total number of eggs he had = 75 + 125 + 100 + 115 = 415
Q3: The line plot below shows how students scored on last week’s math test. How many students scored 95 or higher on the test?
a. 5 students
b. 7 students
c. 11 students
d. 12 students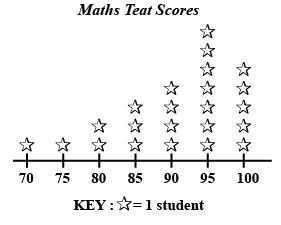
Solution: The correct answer is “D”. It is given that 1 star represents 1 student.
Students getting 95 marks = 7
Students getting 100 marks = 5
Therefore students getting 95 or above = 5 + 7= 12 students
|
81 videos|423 docs|31 tests
|
FAQs on Points to Remember- Data Handling - Mathematics (Maths) Class 8
| 1. What is data handling and why is it important in daily life? |  |
| 2. How do pie charts help in data representation? |  |
| 3. What are the key steps involved in data handling? |  |
| 4. How can we interpret data from a pie chart effectively? |  |
| 5. What are some common mistakes to avoid in data handling? |  |


