NCERT Solutions for Class 8 Maths Chapter 4 - Data Handling - 1 (Exercise 4.1)

Exercise 4.1
Q1: A survey was made to find the type of music that a certain group of young people liked in a city. Adjoining pie chart shows the findings of this survey.
From this pie chart answer the following:
(i) If 20 people liked classical music, how many young people were surveyed?
(ii) Which type of music is liked by the maximum number of people?
(iii) If a cassette company were to make 1000 CD’s, how many of each type would they make?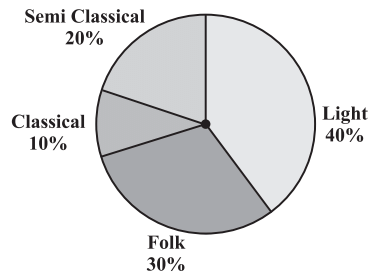
Sol: (i) 10% represents 100 people.
⟹ 20% represents = (100×20)/10 = 200
∴ 200 people were surveyed.
(ii) Since 40% of the total people surveyed liked light music and no other form of song was liked more than that, we can conclude that light music is liked by the maximum number of people.
(iii) CDs of classical music = (10 × 1000)/100 = 100
CDs of semi-classical music = (20 × 1000)/100 = 200
CDs of light music = (40 × 1000)/100 = 400
CDs of folk music = (30 × 1000)/100 = 300
Q2: A group of 360 people were asked to vote for their favourite season from the three seasons rainy, winter and summer.
(i) Which season got the most votes?
(ii) Find the central angle of each sector.
(iii) Draw a pie chart to show this information.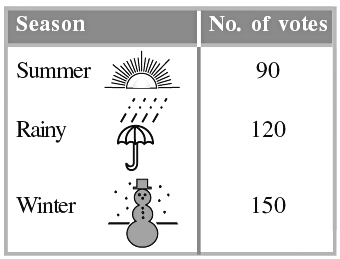
Sol: (i) According to the table given in the question, the winter season got the most votes.
(ii) Central angle of summer season = (90° × 360°)/360° = 90°
Central angle of rainy season= (120° × 360°)/360° = 120°
Central angle of winter season= (150° × 360°)/360° = 150°
(iii) 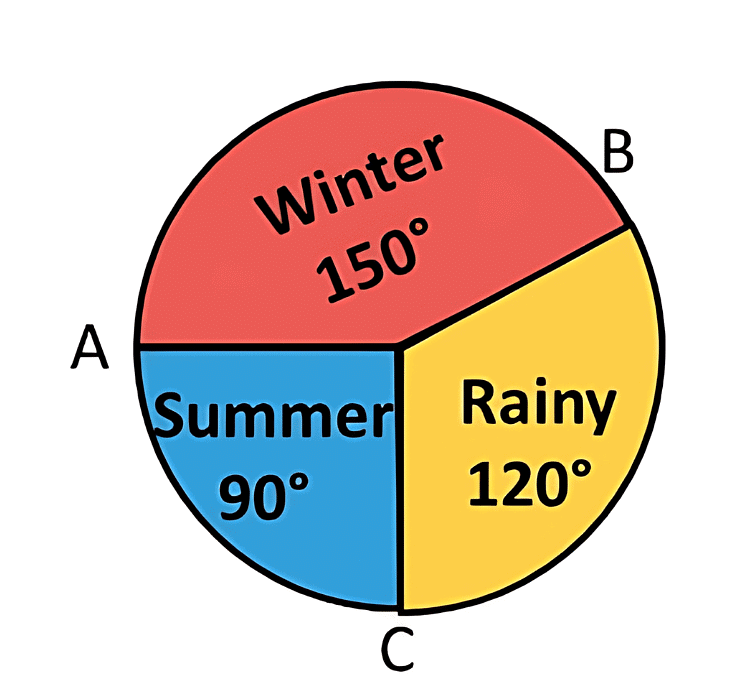
Q3: Draw a pie chart showing the following information. The table shows the colours preferred by a group of people.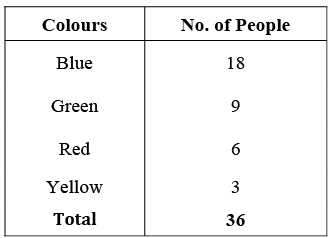
Find the proportion of each sector. For example, Blue is 18/36 = 1/2 ; Green is 9/36 =1/4 and so on.
Use this to find the corresponding angles.
Sol: Central angle of the sector corresponding to:
(a) The blue colour 
(b) The green colour 
(c) The red colour 
(d) The yellow colour 
Thus, the required pie chart is given below;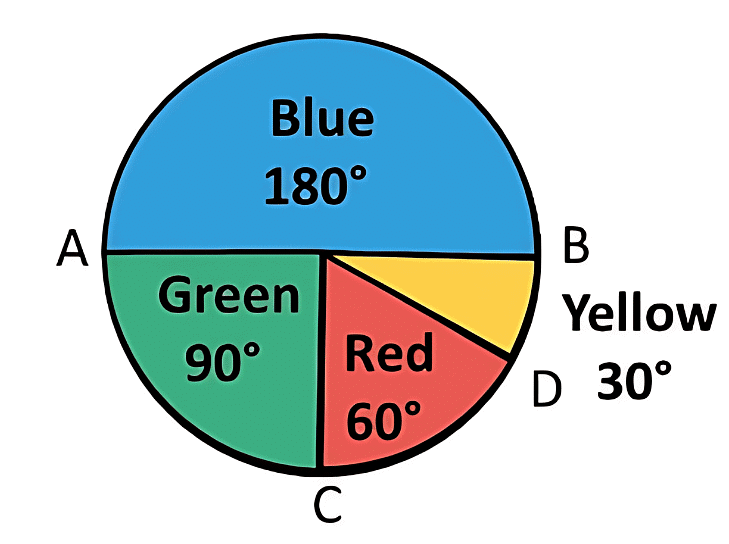
Q4: The adjoining pie chart gives the marks scored in an examination by a student in Hindi, English, Mathematics, Social Science and Science. If the total marks obtained by the students were 540, answer the following questions.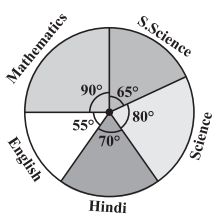
(i) In which subject did the student score 105 marks?
(Hint: for 540 marks, the central angle = 360°. So, for 105 marks, what is the central angle?)
(ii) How many more marks were obtained by the student in Mathematics than in Hindi?
(iii) Examine whether the sum of the marks obtained in Social Science and Mathematics is more than that in Science and Hindi. (Hint: Just study the central angles).
Sol: (i) Total marks = 540
∴ Central angle corresponding to 540 marks = 360°
Central angle corresponding to 105 marks 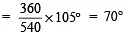
Since the sector having central angle 70° is corresponding to Hindi.
Thus, the student obtained 105 marks in Hindi.
(ii) ∵ The central angle corresponding to the sector of Mathematics = 90°
∴ Marks obtained in Mathematics 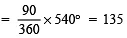
Thus, marks more in Mathematics than in Hindi = 135 – 105 = 30
(iii) Since, the sum of the central angles for Social Science and Mathematics
= 65° + 90° = 155°
Also, the sum of the central angles for Science and Hindi
= 80° + 70° = 150°
∵ Marks obtained are proportional to the central angles corresponding to various items and 155° > 150°.
∵ Marks of in Science and Mathematics are more than the marks obtained in Science and Hindi.
Q5: The number of students in a hostel, speaking different languages is given below. Display the data in a pie chart.
Sol: The central angle for each language is calculated as below,
Pie chart for above data is drawn as below: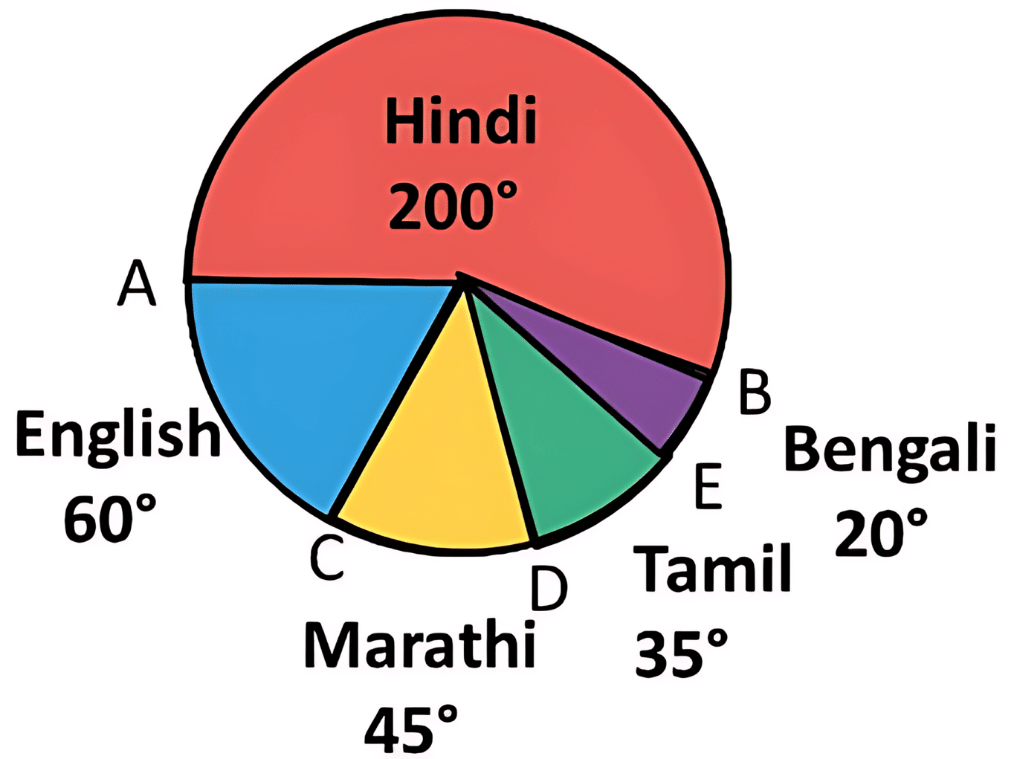
Exercise 4.2
Q1: List the outcomes you can see in these experiments.
(a) Spinning a wheel
(b) Tossing two coins together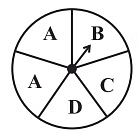
Sol: (a) Outcomes is spinning the given wheel are: A, B, C or D.
(b) Outcomes in tossing two coins together are: HT, HH, TH, TT
[where HT → Head on first coin + Tail on second coin and so on]
Q2: When a die is thrown, list the outcomes of an event of getting
(i) (a) a prime number (b) not a prime number
(ii) (a) a number greater than 5 (b) a number not greater than 5.
Sol: Possible outcomes are: 1, 2, 3, 4, 5 or 6.
Out of them prime numbers are 2, 3 and 5.
(i) (a) Outcomes of getting a prime number are: 2, 3 or 5.
(b) Outcomes of getting not a prime number are: 1, 4 or 6
(ii) (a) Outcome of getting a number greater than 5 is 6.
(b) Outcomes of getting a number not greater than 5 are: 1, 2, 3, 4 or 5.
Q3: Find:
(a) Probability of the pointer stopping on D in (Question 1-(a))?
(b) Probability of getting an ace from a well shuffled deck of 52 playing cards?
(c) Probability of getting a red apple. (See figure below)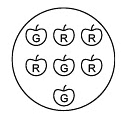
Sol: (a) On the spinning wheel there are 5 sectors containing A, B, C and D.
Since, there is only 1 sector containing D.
i.e. possible outcome = 1
Number of equally likely outcomes = 5
∴ Probability = 1/5
(b) Number of possible outcomes = 52
Since, there are 4 aces in a pack of 52 cards, and out of them one ace can be obtained in 4 ways.
∴ Equally likely outcomes = 4
∴ Probability of getting an ace = 4/52 = 1/13
(c) There are 7 apples in all
∴ Possible number of ways = 7
Since, there are 4 red apples: Therefore, a red apple can be obtained in 4 ways.
i.e. Equally likely outcome = 4
∴ Probability of getting a red apple = 4/7
Q4: Numbers 1 to 10 are written on ten separate slips (one number on one slip), kept in a box and mixed well. One slip is chosen from the box without looking into it. What is the probability of .
(i) getting a number 6?
(ii) Getting a number less than 6?
(iii) Getting a number greater than 6?
(iv) Getting a 1-digit number?
Sol: Since, there are 10 slips. At a time any slip can be taken out.
∴ Number of total outcomes = 10
Now,
(i) We can get a slip containing the number ‘6’ only once.
∴ Number of favourable outcome = 1
Thus, probability of getting the number 6 = 1/10
(ii) There are five numbers (i.e. 1, 2, 3, 4 and 5) which are less than 6.
∴ Favourable outcomes are 5.
Thus, Probability of getting a number less than six = 5/10 = 1/2
(iii) There are 4 numbers (i.e. 7, 8, 9, 10) which are greater than six.
∴ Favorable outcomes = 4
Thus, probability of getting a number greater than six = 4/10 = 2/5
(iv) There nine one-digit numbers i.e. (1, 2, 3, 4, 5, 6, 7, 8 and 9)
∴ Favorable outcomes = 9
Thus, probability of getting a one-digit number = 9/10
Q5: If you have a spinning wheel with 3 green sectors, 1 blue sector and 1 red sector, what is the probability of getting a green sector? What is the probability of getting a non blue sector
Sol: There are 5 sectors in all (3 green + 1 blue + 1 red).
∴ There are total possible outcomes = 5.
Since, there are 3 green sectors.
i.e. Number of favourable outcomes = 3
Thus, probability of getting a green sector = 3/5
Again, there are 4 non-blue sectors
∴ Favouable outcomes = 4
Thus, probability of getting a ‘non-blue’ sector = 4/5
Q6: Find the probabilities of the events given in Question 2.
Sol: There are 6 outcomes in all (i.e. 1, 2, 3, 4, 5, 6)
(i) Since, there are 3 prime numbers (i.e. 2, 3, and 5)
∴ Favourable outcomes = 3
Thus, probability of getting a prime number = 3/6 = 1/2
(ii) Since, there are 3 non-prime numbers (i.e. 1, 4 and 6)
∴ Favourable outcomes = 3
Thus, the probability of getting a non-prime number = 3/6 = 1/2
(iii) Since, there is 1 number greater than 5 (i.e. 6)
∴ Favourable outcome = 1
Thus, probability of a number greater than 5 = 1/6
(iv) Since, there are 5 numbers which are not greater than 5 (i.e. 1, 2, 3, 4 and 5)
∴ Number of favourable outcomes = 5
Thus, the probability of a number which is not greater than 5 = 5/6
|
94 videos|549 docs|42 tests
|
FAQs on NCERT Solutions for Class 8 Maths Chapter 4 - Data Handling - 1 (Exercise 4.1)
| 1. What is data handling in mathematics? |  |
| 2. What are the different types of data in data handling? | |
| 3. How is data represented in a bar graph? | |
| 4. What is the purpose of data handling in real life? | |
| 5. How can data handling help in improving decision-making? | |


Free
,past year papers
,NCERT Solutions for Class 8 Maths Chapter 4 - Data Handling - 1 (Exercise 4.1)
,Objective type Questions
,mock tests for examination
,Summary
,NCERT Solutions for Class 8 Maths Chapter 4 - Data Handling - 1 (Exercise 4.1)
,Viva Questions
,Extra Questions
,video lectures
,Sample Paper
,study material
,ppt
,Exam
,Previous Year Questions with Solutions
,Important questions
,Semester Notes
,NCERT Solutions for Class 8 Maths Chapter 4 - Data Handling - 1 (Exercise 4.1)
,practice quizzes
,shortcuts and tricks
,MCQs
;


NCERT Solutions: Data Handling (Exercise 4.1, 4.2) Free PDF Download
Importance of NCERT Solutions: Data Handling (Exercise 4.1, 4.2)
NCERT Solutions: Data Handling (Exercise 4.1, 4.2) Notes
NCERT Solutions: Data Handling (Exercise 4.1, 4.2) Class 8 Questions
Study NCERT Solutions: Data Handling (Exercise 4.1, 4.2) on the App
|
© EduRev
|
Education Revolution
|


|


