Linear Programming Problems (LPP) via Graphical Method, Business Mathematics and Statistics | Business Mathematics and Statistics - B Com PDF Download

THE GRAPHICAL METHOD FOR SOLVING LPM.
This method can be used when the number of variables is at most three.
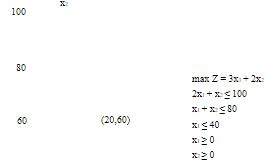
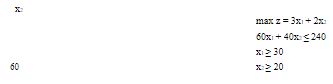
Example 1. Solve the following linear programming problem:
40
Step 1 We label the variables x1,x2 and coordinate axes x1,x2 and graph the set of points satisfying the linear inequalities (or equalities) involving the two variables (it is possible to do this in three dimensional space). This set of points is called the feasible region (the shaded area on the Figure).
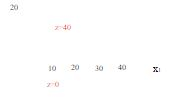
Step 2 We draw contours of the objective function Z = a1x1 + a2 = 3x1 + 2x2 for a few values of Z. In this case, we take Z = 0,Z = 60 and Z = 180. These lines are called isoprofit lines. Once we have drawn the isoprofit line we can generate other lines by moving parallel to this line in the direction in which Z increases (for a max problem). The last isoprofit line intersecting (touching) the feasible region defines the largest Z-value and determines the optimal solution to the model.
The optimal(maximizing) solution is x1 = 20, x2 = 60, Z = 180. This problem has exactly one optimal solution
THE GRAPHICAL METHOD FOR SOLVING LPM.
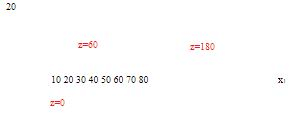
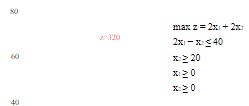
Example 2. Solve the following linear programming problem
40
20
This problem has multiple optimal(or alternative optimal) solutions. This means that there is an infinite number of optimal solutions. (Every point on the line segment connecting the points (0,80) and (20,60) is optimal, with Z = 160). We may express the set of optimal solution as follows:
x1 = 0t + 20(1 − t)
x2 = 80t + 60(1 − t)
t ∈ [0, 1]
Example 3. Solve the following problem
x2
Unbounded Optimal Solution. The following problem has no optimal solution, because it is possible to find points in the feasible region with an arbitrarily large Z-value.
Example4. Solve the following problem:
40
20
This problem has no optimal solution - the set of feasible solutions is empty (Empty Feasible Region). The system of inequalities(and/or equalities ) defining the feasible region is inconsistent.
Observations From the graphical solution of two-variable linear programming problems we see that:
-
The set of feasible solutions (feasible region)of a linear programming problem(LPP) is a convex set. The set D in n-dimensional space is a convex set if the line segment joining any pair of points in D is wholly contained in D.
-
There is only a finite number of extreme points(corner points) in the set of feasible solutions. For any convex set D, a point P is an extreme point if each line segment that lies completely in D and contains the point P has P as an end point of the line segment.
-
The optimal solution is attained (if it exists) in at least one extreme point.
Every LPP must fall into one of the following four cases:
1. There is only one optimal solution which is an extreme point (corner point) of the set of feasible solutions.
2. There are alternative optimal solutions (an infinite number of optimal solutions), but at least one optimal solution occurs at an extreme point (cornerpoint) of the set of feasible solutions to the LPP.
3. The LPP is unbounded: There are points in the set of feasible solutions with an arbitrarily large Z- value (max problem) or arbitrarily small Z- value (min problem).
4. The LPP is infeasible: The set of feasible solutions is the empty set(The feasible region contains no points).
All the above facts can be proved for any LPP.
|
124 videos|176 docs
|
FAQs on Linear Programming Problems (LPP) via Graphical Method, Business Mathematics and Statistics - Business Mathematics and Statistics - B Com
| 1. What is linear programming and how is it applied in business mathematics and statistics? |  |
| 2. What is the graphical method for solving linear programming problems? | |
| 3. Can linear programming be used to solve real-world business problems? | |
| 4. Are there any limitations or assumptions associated with linear programming? | |
| 5. What are the advantages of using linear programming in business decision-making? | |


Sample Paper
,Business Mathematics and Statistics | Business Mathematics and Statistics - B Com
,Business Mathematics and Statistics | Business Mathematics and Statistics - B Com
,video lectures
,Summary
,Semester Notes
,Important questions
,practice quizzes
,Objective type Questions
,study material
,Previous Year Questions with Solutions
,Linear Programming Problems (LPP) via Graphical Method
,Linear Programming Problems (LPP) via Graphical Method
,Viva Questions
,MCQs
,Business Mathematics and Statistics | Business Mathematics and Statistics - B Com
,Extra Questions
,Free
,ppt
,mock tests for examination
,past year papers
,Exam
,shortcuts and tricks
,Linear Programming Problems (LPP) via Graphical Method
,


Linear Programming Problems (LPP) via Graphical Method, Business Mathematics and Statistics Free PDF Download
Importance of Linear Programming Problems (LPP) via Graphical Method, Business Mathematics and Statistics
Linear Programming Problems (LPP) via Graphical Method, Business Mathematics and Statistics Notes
Linear Programming Problems (LPP) via Graphical Method, Business Mathematics and Statistics B Com Questions
Study Linear Programming Problems (LPP) via Graphical Method, Business Mathematics and Statistics on the App
|
© EduRev
|
Education Revolution
|


|


