B Com Exam  >  B Com Notes  >  Business Mathematics and Statistics  >  Extrapolation - Interpolation and Extrapolation, Business Mathematics and Statistics

Extrapolation - Interpolation and Extrapolation, Business Mathematics and Statistics | Business Mathematics and Statistics - B Com PDF Download

Extrapolation is a useful statistical tool used to estimate values that go beyond a set of given data or observations. In this lesson, you will learn how to estimate or predict values using this tool.


Definition and Use of Extrapolation

Extrapolation is the process of finding a value outside a data set. It could even be said that it helps predict the future! To help us remember what it means, we should think of the part of the word 'extra' as meaning 'more' data than what we originally had. This tool is not only useful in statistics but also useful in science, business, and anytime there is a need to predict values in the future beyond the range we have measured. There are several methods for extrapolation, but in this lesson we will focus on linear extrapolation, which is using a linear equation to find a value outside a data set.


Example 1

Let's try a basic extrapolation by finding values in a numerical sequence. When using extrapolation, we look for the relationship between the given values. So, let's look at the following numerical sequence. What is the relationship between the values in the sequence?

2,4,6,8, ?

Pretty easy, right? The numbers in the sequence are increasing by 2. Now, by using extrapolation we can predict the fifth term in each sequence. The fifth term of the sequence is 10. However, extrapolation goes beyond estimating future values in numerical sequences, as we will see in the next example.


Example 2

My friend Mary planted a bean plant, and she has been measuring and keeping track of its growth for the past four days. Based on her observations, she wants to estimate how tall her plant will be on the 5th day.

Her chart of observations looks like this:

Extrapolation - Interpolation and Extrapolation, Business Mathematics and Statistics | Business Mathematics and Statistics - B Com

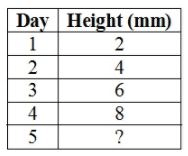
Based on Mary's chart, it is not too difficult to predict that the plant will be 10 mm tall on the fifth day. But, what if Mary wanted to predict the plant's height on the tenth day? In that case, extrapolating from a graph would come in handy. To illustrate this, let's plot her observations on a graph. When we plot the data, we realize there is a linear relationship between the number of days and the growth of the plant.

Extrapolation - Interpolation and Extrapolation, Business Mathematics and Statistics | Business Mathematics and Statistics - B Com

On the graph, we can also see that there are data points for four days of observation. However, Mary wants to know how tall her plant will be on the tenth day. This would not be too difficult to do using extrapolation. We just need to draw a line through the data points and then extend the line past the tenth day mark.

If we take a look at the next graph, we can see the extended line and with that, we can estimate that the height of the plant would be 20 mm on the tenth day.

Extrapolation - Interpolation and Extrapolation, Business Mathematics and Statistics | Business Mathematics and Statistics - B Com

The document Extrapolation - Interpolation and Extrapolation, Business Mathematics and Statistics | Business Mathematics and Statistics - B Com is a part of the B Com Course Business Mathematics and Statistics.
All you need of B Com at this link: B Com
115 videos|142 docs

FAQs on Extrapolation - Interpolation and Extrapolation, Business Mathematics and Statistics - Business Mathematics and Statistics - B Com

1. What is the difference between interpolation and extrapolation?
Ans. Interpolation and extrapolation are both techniques used in mathematics and statistics to estimate values between or beyond given data points. The main difference between them is that interpolation is used to estimate values within the range of the given data, while extrapolation is used to estimate values outside the range of the given data. Interpolation involves using the existing data points to estimate values between those points. It assumes that the relationship between the data points is continuous and can be represented by a smooth curve or line. Interpolation is commonly used to fill in missing data or to estimate values at specific points within a given range. On the other hand, extrapolation involves using the existing data points to estimate values beyond the range of the given data. It assumes that the relationship between the data points extends beyond the observed range. However, extrapolation is less reliable than interpolation because it relies on the assumption that the relationship between the data points remains the same outside the observed range. Extrapolation should be used with caution as it may lead to inaccurate or unreliable estimates. In summary, interpolation is used to estimate values within the given data range, while extrapolation is used to estimate values beyond the given data range.
2. How is interpolation applied in business mathematics and statistics?
Ans. In business mathematics and statistics, interpolation is commonly used to estimate values within a given range based on existing data points. Here are a few examples of how interpolation is applied in business: 1. Sales Forecasting: Businesses often use historical sales data to forecast future sales. Interpolation techniques can be used to estimate sales figures for specific time periods within the observed range, which can help businesses plan their production, inventory, and marketing strategies. 2. Pricing Analysis: Businesses may use interpolation to estimate prices for products or services based on the pricing of similar products or services within a specific range. This can help businesses determine competitive pricing strategies and optimize revenue. 3. Demand Estimation: Interpolation can be used to estimate demand for a product or service based on historical sales data. By analyzing the relationship between sales and various factors such as price, advertising expenditure, and market size, businesses can use interpolation to estimate demand at different price points or market sizes. 4. Financial Analysis: Interpolation techniques are commonly used in financial analysis to estimate values such as future cash flows, interest rates, or stock prices. By interpolating data points from historical financial data, businesses can make informed decisions about investments, loans, or financial projections. Overall, interpolation plays a crucial role in various aspects of business mathematics and statistics, helping businesses make informed decisions and predictions based on existing data.
3. What are the limitations of extrapolation in business mathematics and statistics?
Ans. While extrapolation can be a useful technique for estimating values beyond the observed data range, it is important to be aware of its limitations in business mathematics and statistics. Here are some limitations of extrapolation: 1. Assumption of Continuity: Extrapolation assumes that the relationship between the observed data points continues beyond the observed range. However, this assumption may not always hold true in real-world business scenarios. Factors such as changing market conditions, consumer behavior, or technological advancements can significantly alter the relationship between data points, leading to inaccurate extrapolations. 2. Uncertainty and Risk: Extrapolation involves making predictions based on limited data. The further the extrapolation goes beyond the observed range, the greater the uncertainty and risk associated with the estimates. Business decisions based on extrapolation can be risky, as they rely on assumptions that may not be accurate or reliable. 3. Sensitivity to Outliers: Extrapolation can be sensitive to outliers, which are extreme values that deviate significantly from the general pattern of the data. Outliers can disproportionately influence the extrapolated estimates, leading to inaccurate predictions. It is essential to identify and handle outliers appropriately to minimize their impact on extrapolation results. 4. Lack of Validation: Since extrapolation involves estimating values beyond the observed data range, it is challenging to validate the accuracy of the extrapolated estimates. The lack of validation makes it difficult to assess the reliability and robustness of the extrapolation results, increasing the risk of making incorrect business decisions based on unreliable estimates. Given these limitations, it is important to use extrapolation cautiously in business mathematics and statistics, considering alternative methods and validating the results whenever possible.
4. What are the potential risks of relying solely on extrapolation in business decision-making?
Ans. Relying solely on extrapolation in business decision-making can pose several potential risks: 1. Inaccurate Forecasts: Extrapolation assumes that the relationship between the observed data points continues beyond the observed range. However, this assumption may not always hold true, especially in rapidly changing business environments. Relying solely on extrapolation can lead to inaccurate sales forecasts, demand estimates, or financial projections, which can result in poor resource allocation, inventory management, and financial planning. 2. Over- or Underestimation: Extrapolation relies on the assumption of a consistent relationship between the observed data points. However, business dynamics, market conditions, and consumer behavior can evolve over time, leading to changes in the relationship between variables. By solely relying on extrapolation, businesses may overestimate or underestimate future trends, leading to incorrect pricing decisions, production plans, or investment strategies. 3. Lack of Contextual Understanding: Extrapolation focuses solely on the mathematical relationship between data points, ignoring the contextual factors that may influence the variables being extrapolated. By solely relying on extrapolation, businesses may overlook important qualitative factors, such as market trends, competitive landscape, or regulatory changes, which can significantly impact business outcomes. A holistic approach that combines quantitative analysis with qualitative insights is essential for robust decision-making. 4. Increased Vulnerability to Uncertainty: Extrapolation involves making predictions based on limited data, and the further the extrapolation goes beyond the observed range, the greater the uncertainty and risk associated with the estimates. Relying solely on extrapolation can make businesses more vulnerable to unexpected changes, shocks, or disruptions that are not captured by the extrapolation model. This can result in missed opportunities, excessive risk exposure, or inability to adapt to changing market conditions. To mitigate these risks, businesses should consider using a combination of extrapolation with other forecasting techniques, such as scenario analysis, expert judgment, market research, or simulation models. By incorporating multiple perspectives and considering the limitations of extrapolation, businesses can make more robust and informed decisions.
5. What are some alternative techniques to extrapolation in business mathematics and statistics?
Ans. While extrapolation can be a valuable tool, it is important to consider alternative techniques in business mathematics and statistics to enhance the accuracy and reliability of predictions. Here are some alternative techniques to extrapolation: 1. Time Series Analysis: Time series analysis involves analyzing historical data to identify patterns, trends, and seasonality. It can provide insights into the underlying dynamics of the data and help forecast future values based on the observed patterns. Time series models, such as ARIMA (AutoRegressive Integrated Moving Average), exponential smoothing, or state-space models, are commonly used in business forecasting. 2. Regression Analysis: Regression analysis examines the relationship between a dependent variable and one or more independent variables. By fitting a regression model to historical data, businesses can estimate the impact of various factors on the dependent variable and make predictions based on the model. Regression analysis allows for more comprehensive modeling of complex relationships compared to extrapolation, which assumes a simple relationship between data points. 3. Machine Learning: Machine learning algorithms, such as neural networks, random forests, or support vector machines, can be powerful tools for forecasting in business. These algorithms can capture complex patterns and nonlinear relationships in the data, allowing for more accurate and flexible predictions. Machine learning techniques require larger datasets and more computational resources compared to traditional methods like extrapolation. 4. Expert Judgment: In some cases, expert judgment can be a valuable alternative to extrapolation. Experts with domain knowledge and experience can provide qualitative insights and predictions based on their expertise. Combining expert judgment with quantitative analysis can lead to more robust and reliable forecasts. 5. Sensitivity Analysis: Sensitivity analysis involves testing the impact of changes in input variables on the output of a model. By varying the assumptions or data inputs and observing the resulting changes in the forecasted values, businesses can assess the sensitivity and reliability of the forecasts. Sensitivity analysis helps identify the key drivers and sources of uncertainty in the forecasts, allowing businesses to make more informed decisions. By considering these alternative techniques, businesses can improve the accuracy, reliability, and robustness of their predictions, reducing the risks associated with relying solely on extrapolation.
115 videos|142 docs
Download as PDF
Explore Courses for B Com exam
Signup for Free!
Signup to see your scores go up within 7 days! Learn & Practice with 1000+ FREE Notes, Videos & Tests.
10M+ students study on EduRev
Related Searches

Business Mathematics and Statistics | Business Mathematics and Statistics - B Com

,

Viva Questions

,

past year papers

,

shortcuts and tricks

,

Extrapolation - Interpolation and Extrapolation

,

video lectures

,

Important questions

,

ppt

,

MCQs

,

Semester Notes

,

pdf

,

mock tests for examination

,

Summary

,

Extrapolation - Interpolation and Extrapolation

,

Previous Year Questions with Solutions

,

Exam

,

Extrapolation - Interpolation and Extrapolation

,

Objective type Questions

,

study material

,

Business Mathematics and Statistics | Business Mathematics and Statistics - B Com

,

Sample Paper

,

practice quizzes

,

Extra Questions

,

Free

,

Business Mathematics and Statistics | Business Mathematics and Statistics - B Com

;