Frequency Distribution - Presentation of Data, Business Mathematics & Statistics | SSC CGL Tier 2 - Study Material, Online Tests, Previous Year PDF Download

FREQUENCY DISTRIBUTION
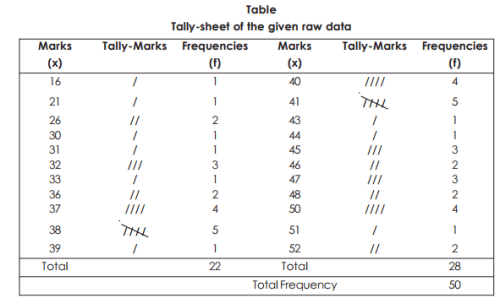
Frequency of a value of a variable is the number of times it occurs in a given series of observations. A tallysheet may be used to calculate the frequencies from the raw data (primary data not arranged in the Tabular form). A tally-mark (/) is put against the value when it occurs in the raw data. The following example shows how raw-data can be represented by a tally-sheet :
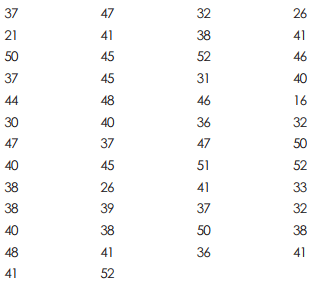
Example 2 : Raw data Marks in Mathematics of 50 students
Such a representation of the data is known as the Frequency Distribution. The number of classes should neither be too large nor too small. It should not exceed 20 but should not be less than 5, normally, depending on the number of observations in the raw data.
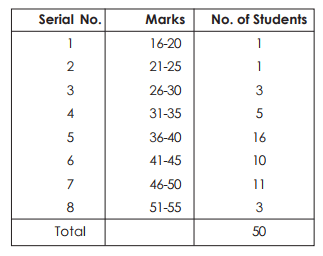
Group Frequency Distribution : When large masses of raw data are to be summarised and the identity of the individual observation or the order in which observations arise are not relevant for the analysis, we distribute the data into classes or categories and determine the number of individuals belonging to each class, called the class-frequency. A tabular arrangement of raw data by classes where the corresponding class-frequencies are indicated is known as Grouped Frequency distribution.
Grouped Frequency Distribution of Marks of 50 students in Mathematics
Few Terms (associated with grouped frequency distribution) :
(a) Class-interval
(b) Class-frequency, total frequency
(c) Class-limits (upper and lower)
(d) Class boundaries (upper and lower)
(e) Mid-value of class interval (or class mark)
(f) Width of class interval
(g) Frequency denisty (
h) Percentage Frequency.
(a) Class-interval : In the above table, class intervals are 16-20, 21-25 …. etc. In all there are eight class-intervals. If, however, one end of class-interval is not given then it is known as open-end class. For example, less than 10, 10-20, 20-30, 30 and above. The class-interval having zero frequency is know as empty class.
(b) Class frequency : The number of observations (frequency) in a particular class-interval is known as class-frequency. In the table, for the class-interval 26-30, class frequency is 3 and so on. The sum of all frequencies is total frequency. Here in the table total frequency is 50.
(c) Class limits : The two ends of a class-interval are called class-limits.
(d) Class boundaries : The class boundaries may be obtained from the class limits as follows : Lower class-boundary = lower class limit – ½ d Upper class-boundary = upper class limit + ½ d Where d = common difference between upper class of any class-interval with the lower class of the next class-interval. In the table d = 1.
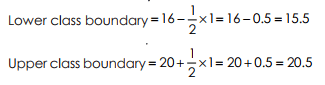
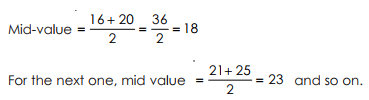
Again, for the next class-interval, lower class-boundary = 20.5, upper class boundary = 25.5 and so on.
(e) Mid value : (or class mark). It is calculated by adding the two class limits divided by 2. In the above table : for the first class-interval
(f) Width : The width (or size) of a class interval is the difference between the class-boundaries (not class limits)
Width = Upper class boundary – lower class boundary
For the first class, width = 20.5 – 15.5 = 5
For the second class width = 25.5 – 20.5 = 5, so on.
(g) Frequency density : It is the ratio of the class frequency to the width of that
class-interval i.e. frequency density = 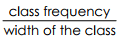
For the first class frequency density 
For the third class frequency density
(h) Percentage frequency : It is the ratio of class-frequency to total frequency expressed as percentage
i.e. percentage frequency 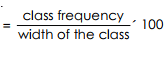
In the table for the frequency 5, % frequency 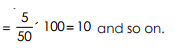
Cumulative
Frequency distribution : As the name suggests, in this distribution, the frequencies are cumulated. This is prepared from a grouped frequency distribution showing the class boundaries by adding each frequency to the total of the previous one, or those following it. The former is termed as Cumulative frequency of less than type and the latter, the cumulative frequency of greater than type.
Example 3 : The following is an array of 65 marks obtained by students in a certain examination : –
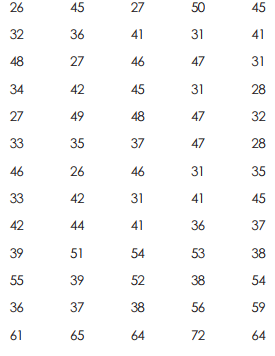
Draw up a frequency distribution table classified on the basis of marks with class-intervals of 5.
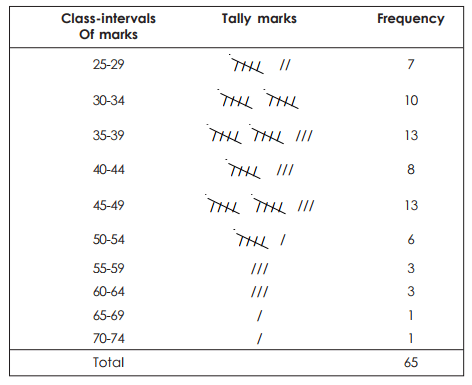
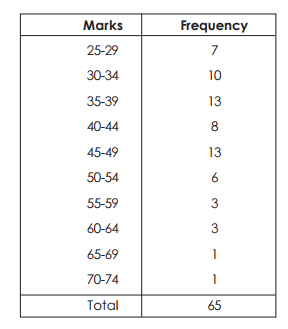
Now the required frequency distribution is shown below :
Frequency distribution of marks obtained by 65 students
|
1335 videos|1437 docs|834 tests
|
FAQs on Frequency Distribution - Presentation of Data, Business Mathematics & Statistics - SSC CGL Tier 2 - Study Material, Online Tests, Previous Year
| 1. What is a frequency distribution? |  |
| 2. How is a frequency distribution useful in business mathematics and statistics? | |
| 3. What are the steps involved in creating a frequency distribution? | |
| 4. What are the advantages of using a frequency distribution? | |
| 5. How can a frequency distribution be used to make business decisions? | |


Semester Notes
,study material
,Summary
,Business Mathematics & Statistics | SSC CGL Tier 2 - Study Material
,ppt
,Business Mathematics & Statistics | SSC CGL Tier 2 - Study Material
,Previous Year
,past year papers
,Exam
,Business Mathematics & Statistics | SSC CGL Tier 2 - Study Material
,Frequency Distribution - Presentation of Data
,Important questions
,Extra Questions
,Frequency Distribution - Presentation of Data
,shortcuts and tricks
,Previous Year Questions with Solutions
,Frequency Distribution - Presentation of Data
,MCQs
,Online Tests
,video lectures
,mock tests for examination
,Previous Year
,Sample Paper
,Previous Year
,practice quizzes
,Online Tests
,Viva Questions
,Free
,Objective type Questions
,Online Tests
;


Frequency Distribution - Presentation of Data, Business Mathematics & Statistics Free PDF Download
Importance of Frequency Distribution - Presentation of Data, Business Mathematics & Statistics
Frequency Distribution - Presentation of Data, Business Mathematics & Statistics Notes
Frequency Distribution - Presentation of Data, Business Mathematics & Statistics SSC CGL Questions
Study Frequency Distribution - Presentation of Data, Business Mathematics & Statistics on the App
|
© EduRev
|
Education Revolution
|


|


