Frequency polygon and frequency curve - Presentation of Data, Business Mathematics & Statistics | SSC CGL Tier 2 - Study Material, Online Tests, Previous Year PDF Download

FREQUENCY POLYGON
A frequency polygon is obtained by plotting the frequency of the class against its class marks, and joining the parts with line segments.
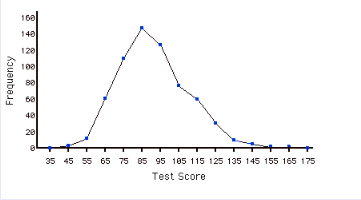
Frequency polygon can also be drawn with the help of histogram by joining their mid points of rectangle.
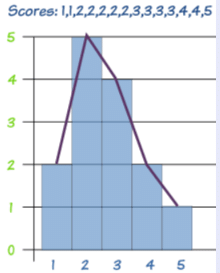
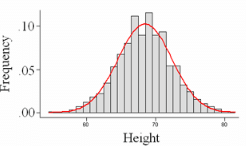
Frequency Curve
When the consecutive points on the graph join with a specific pattern smoothly shown in the below example. Frequency curve can also be drawn with the help of histogram by joining their mid points of rectangle. Frequency polygon and frequency curves are same except frequency curve is drawn using free hand and frequency polygon is drawn using scale. (Each point is joint using scale)
CUMULATIVE FREQUENCY CURVE
The cumulative frequency curve/polygon is obtained by plotting the cumulative frequency against the upper class boundary.
In cumulative frequency curve we draw using using free hand and in cumulative frequency polygon we draw each point using scale.
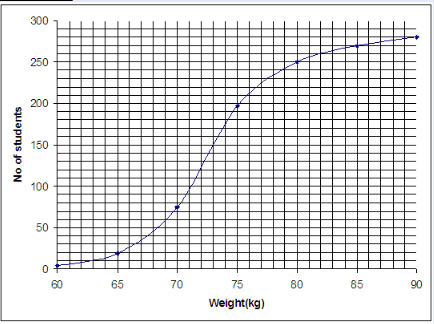
To draw this graph we have to make cumulative frequency table. We add up all the frequency step by step.
For example#000000 solid;margin:15px;width:95%;">
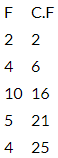
After calculating CF which is cumulative frequency we plot the points and join it.
|
1335 videos|1432 docs|834 tests
|
FAQs on Frequency polygon and frequency curve - Presentation of Data, Business Mathematics & Statistics - SSC CGL Tier 2 - Study Material, Online Tests, Previous Year
| 1. What is a frequency polygon and how is it used to present data? |  |
| 2. How is a frequency curve different from a frequency polygon? | |
| 3. What are the advantages of using a frequency polygon or frequency curve to present data? | |
| 4. How can frequency polygons or frequency curves be used in business mathematics and statistics? | |
| 5. Can frequency polygons or frequency curves be used to determine the probability of an event? | |


Viva Questions
,Previous Year Questions with Solutions
,Previous Year
,Previous Year
,study material
,Online Tests
,Previous Year
,Free
,video lectures
,Important questions
,Online Tests
,mock tests for examination
,Summary
,MCQs
,Semester Notes
,Frequency polygon and frequency curve - Presentation of Data
,Business Mathematics & Statistics | SSC CGL Tier 2 - Study Material
,Sample Paper
,ppt
,Frequency polygon and frequency curve - Presentation of Data
,Extra Questions
,practice quizzes
,past year papers
,Business Mathematics & Statistics | SSC CGL Tier 2 - Study Material
,Objective type Questions
,Online Tests
,Exam
,shortcuts and tricks
,Frequency polygon and frequency curve - Presentation of Data
,Business Mathematics & Statistics | SSC CGL Tier 2 - Study Material
;


Frequency polygon and frequency curve - Presentation of Data, Business Mathematics & Statistics Free PDF Download
Importance of Frequency polygon and frequency curve - Presentation of Data, Business Mathematics & Statistics
Frequency polygon and frequency curve - Presentation of Data, Business Mathematics & Statistics Notes
Frequency polygon and frequency curve - Presentation of Data, Business Mathematics & Statistics SSC CGL Questions
Study Frequency polygon and frequency curve - Presentation of Data, Business Mathematics & Statistics on the App
|
© EduRev
|
Education Revolution
|


|


