Construction of statistical tables, Business Mathematics & Statistics | Business Mathematics and Statistics - B Com PDF Download

Construction of a Statistical Table
A statistical table has at least four major parts and some other minor parts.
(1) The Title
(2) The Box Head (column captions)
(3) The Stub (row captions)
(4) The Body
(5) Prefatory Notes
(6) Foot Notes
(7) Source Notes
The general sketch of table indicating its necessary parts is shown below:
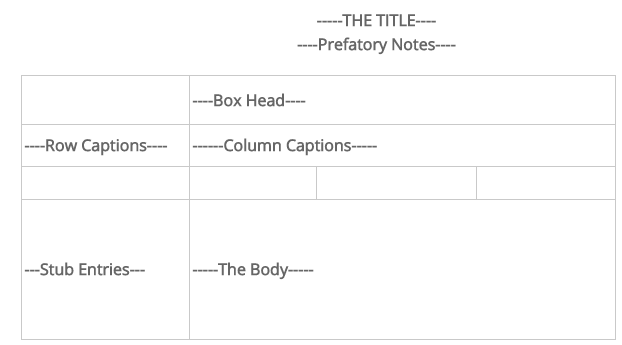
(1) The Title
The title is the main heading written in capitals shown at the top of the table. It must explain the contents of the table and throw light on the table, as whole different parts of the heading can be separated by commas. There are no full stops in the little.
(2) The Box Head (column captions)
The vertical heading and subheading of the column are called columns captions. The spaces where these column headings are written is called the box head. Only the first letter of the box head is in capital letters and the remaining words must be written in lowercase.
(3) The Stub (row captions)
The horizontal headings and sub heading of the row are called row captions and the space where these rows headings are written is called the stub.
(4) The Body
This is the main part of the table which contains the numerical information classified with respect to row and column captions.
(5) Prefatory Notes
A statement given below the title and enclosed in brackets usually describes the units of measurement and is called the prefatory notes.
(6) Foot Notes
These appear immediately below the body of the table providing additional explanation.
(7) Source Notes
The source notes are given at the end of the table indicating the source the information has been taken from. It includes the information about compiling agency, publication, etc.
General Rules of Tabulation
A table should be simple and attractive. There should be no need of further explanation (details). Proper and clear headings for columns and rows are necessary. Suitable approximation may be adopted and figures may be rounded off. The unit of measurement should be well defined. If the observations are large in numbers they can be broken into two or three tables. Thick lines should be used to separate the data under big classes and thin lines to separate the sub classes of data.
|
124 videos|176 docs
|
FAQs on Construction of statistical tables, Business Mathematics & Statistics - Business Mathematics and Statistics - B Com
| 1. What is the purpose of constructing statistical tables in business mathematics and statistics? |  |
| 2. How are statistical tables used in business mathematics and statistics? | |
| 3. What types of statistical tables are commonly used in business mathematics and statistics? | |
| 4. How do statistical tables help in decision-making in business? | |
| 5. Are statistical tables still relevant in the digital age of advanced data analysis software? | |


Previous Year Questions with Solutions
,Viva Questions
,Objective type Questions
,Free
,Extra Questions
,MCQs
,Construction of statistical tables
,ppt
,past year papers
,study material
,practice quizzes
,Business Mathematics & Statistics | Business Mathematics and Statistics - B Com
,Construction of statistical tables
,shortcuts and tricks
,mock tests for examination
,Construction of statistical tables
,video lectures
,Summary
,Exam
,Sample Paper
,Business Mathematics & Statistics | Business Mathematics and Statistics - B Com
,Semester Notes
,Important questions
,Business Mathematics & Statistics | Business Mathematics and Statistics - B Com
;


Construction of statistical tables, Business Mathematics & Statistics Free PDF Download
Importance of Construction of statistical tables, Business Mathematics & Statistics
Construction of statistical tables, Business Mathematics & Statistics Notes
Construction of statistical tables, Business Mathematics & Statistics B Com Questions
Study Construction of statistical tables, Business Mathematics & Statistics on the App
|
© EduRev
|
Education Revolution
|


|


within 7 days!