Measures of Skewness, Business Mathematics & Statistics | SSC CGL Tier 2 - Study Material, Online Tests, Previous Year PDF Download
| Table of contents |
|
| Measure of Skewness |
|
| Definition |
|
| Formulas |
|
| Applications |
|

Measure of Skewness
In statistics, we study about the management, observation and calculation generally over a large numerical data. In the statistical analysis of a survey or research, a researcher is required to know about the distribution, central tendency, dispersion etc.
It is also needed to know that what would be the variability and location of the given data set. This includes the measurement of skewness of the data, since all given data distributions are not symmetric.
Important
The skewness measures how asymmetric the distribution is. We can say that skewness is the measure of asymmetry of the data. It also determines if the data is skewed to the left or to the right.
The measure of skewness is being utilized in many areas. We know that a data which is normally distributed, is said to be symmetric about its mean. It has skewness equal to zero. But usually, the distributions are not symmetric.
Thus, the analysis of skewness becomes mandatory, as it defines the deviations from the mean position. An asymmetric or skewed data is not a perfect mirror image about the mean. By the measurement of skewness, one can determine how mean, median and mode are connected to one another. Let us go ahead in this page and learn about skewness, its calculation and applications in detail.
Definition
Measure of skewness determines the extent of asymmetry or lack of symmetry. A distribution is said to be asymmetric if its graph does not appear similar to the right and to the left around the central position. In more statistical language, the skewness measures how much is the asymmetry of probability distribution of some given real-valued random variable about the mean. Skewness can be observed in the given data when number of observations are less.
For Example: When the numbers 9, 10, 11 are given, we may easily inspect that the values are equally distributed about the mean 10. But if we add a number 5, so as to get the data as 5, 9, 10, 11, then we can say that the distribution is not symmetric or it is skewed.
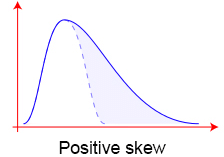
The skewness can be viewed by the having a look at the graph. The measure of skewness can be of two types : positive skew and negative skew.
Positive Skew: When the given distribution concentrates on the left side in the graph, it is known as the positive skew. In the following curve, we may easily observe that the right tail is bigger. This may be called as right-tailed or right-skewed distribution.
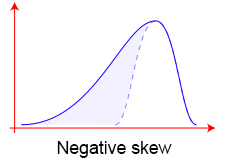
Negative Skew: If in the graph, the concentration of the curve is higher on the right side or the left tail is bigger, then given distribution would known as left tailed or negatively skewed or left skewed. It is shown in the following diagram :
Formulas
There are various measures of skewness of the statistical data. For univariate data, the expression for measurement of skewness is given below:
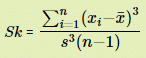
Where, xi = given observations = mean
s = standard deviation
n = number of observations.
For normal distribution, the measure of skewness is zero. When skewness is negative, it means that the data is left skewed. If it is positive, then the data is said to be right skewed.
Pearson’s Coefficient of Skewness
The method of finding skewness is also developed by Karl Pearson. This method is known as "Pearson’s Coefficient of Skewness". According to this method, there are two formulas for the measurement of skewness.
The formula is:

Where, $\bar{x} represents mean of the data, s is the standard deviation and Mo denotes the mode for the given sample.
This formula uses mode, thats why it is called "Pearson Mode Skewness".
There is another formula which utilizes median and eventually it is termed as "Pearson Median Skewness".
This formula is given below:
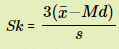
Where, Md stands for median and all other symbols are as above.
These formulas are used according to the given values, i.e. when mode is known, then Pearson mode skewness is used and when median is given, Pearson median skewness is applied.

Where,
M3 = Third moment of the given data and is calculated using the following formula:
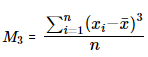
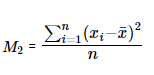
and
M2= Second moment or variance of the data which is measured by the use of following formula :
Applications
Measure of skewness is applied very commonly, since skewed data is seen quite often in different situations. In commerce, the skewness has to be measured very frequently when incomes are skewed to the right or to the left. On the other hand, the data which describes the lifetime of some commodity such as a tubelight, is right skewed. The smallest lifetime may be zero, whereas and the long lasting tubelights will provide the positive skewness to the distribution.
|
1366 videos|1313 docs|1016 tests
|
FAQs on Measures of Skewness, Business Mathematics & Statistics - SSC CGL Tier 2 - Study Material, Online Tests, Previous Year
| 1. What is skewness in business mathematics and statistics? |  |
| 2. How is skewness calculated? | |
| 3. What does a positive skewness value indicate? | |
| 4. How does skewness affect data analysis in business? | |
| 5. Can skewness be used to compare different datasets in business mathematics and statistics? | |


Previous Year
,Previous Year
,past year papers
,Exam
,mock tests for examination
,Previous Year Questions with Solutions
,shortcuts and tricks
,Business Mathematics & Statistics | SSC CGL Tier 2 - Study Material
,Summary
,Sample Paper
,Measures of Skewness
,Previous Year
,Online Tests
,Viva Questions
,study material
,Measures of Skewness
,Semester Notes
,Measures of Skewness
,Extra Questions
,MCQs
,Online Tests
,Objective type Questions
,ppt
,Online Tests
,video lectures
,Business Mathematics & Statistics | SSC CGL Tier 2 - Study Material
,Business Mathematics & Statistics | SSC CGL Tier 2 - Study Material
,Free
,practice quizzes
,Important questions
;


Measures of Skewness, Business Mathematics & Statistics Free PDF Download
Importance of Measures of Skewness, Business Mathematics & Statistics
Measures of Skewness, Business Mathematics & Statistics Notes
Measures of Skewness, Business Mathematics & Statistics SSC CGL Questions
Study Measures of Skewness, Business Mathematics & Statistics on the App
|
© EduRev
|
Education Revolution
|


|


