Regression analysis - Correlation & Regression, Business Mathematics & Statistics | SSC CGL Tier 2 - Study Material, Online Tests, Previous Year PDF Download

INTRODUCTION
In the last chapter we studied the concept of statistical relationship between two variables such as -amount of fertilizer used and yield of a crop; price of a product and its supply, level of sales and amount of advertisement and so on.
The relationship between such variables do indicate the degree and direction of their association, but they do not answer the question that whether there is any functional (or algebraic) relationship between two variables? If yes, can it be used to estimate the most likely value of one variable, given the value of other variable?
“In regression analysis we shall develop an estimating equation i.e., a mathematical formula that relates the known variables to the unknown variable. (Then, after we have learned the pattern of this relationship, we can apply correlation analysis to determine the degree to which the variables are related. Correlation analysis, then, tells us how well the estimating equation actually describes the relationship). The variable which is used to predict the unknown variables is called the ‘independent’ or ‘explaining’ variable, and the variable whose value is to be predicted is called the ‘dependent’ or ‘explained’ variable.” Ya-lun Chou
DISTINCTION BETWEEN CORRELATION AND REGRESSION
By correlation we mean the degree of association or relationship between two or more variables. Correlation does not predict anything about the cause & effect relationship. Even a high degree of correlation does not imply necessarily that a cause & effect relationship exists between the two variables.
Whereas in case of regression analysis, there is a functional relationship between Y and X such that for each value of Y there is only one value of X. One of the variables is identified as a dependent variable the other(s) as independent valuable(s). The expression is derived for the purpose of predicting values of a dependent variable on the basis of independent valuable(s).
REGRESSION LINES
A regression line is the line which shows the best mean values of one variable correspond-ing to mean values of the other. With two series X and Y, there are two arithmetic regression lines, one showing the best mean values of X corresponding to mean Y’s and the other showing the best mean values of Y corresponding to mean X’s. In the context of scatter diagram, the regression line is the straight line that best fits the scatter diagram. The most commonly used criteria is that it is the straight line that minimise the sum of the squared deviations between the predicted and observed values of the dependent variable. In the case of two variables X and Y, there will be two regression lines as the regression of X on Y and regression of Y on X.
REGRESSION EQUATIONS
There are different methods of deriving regression equations (1) By taking actual values of X and Y (2) By taking deviations from actual mean (3) By taking deviations from assume mean
Yc = a+bX
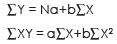
Where a and b can be found out by solving the following two normal equations simultaneously:
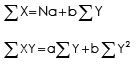
The regression equation of X on Y is expressed as follows:
Xc = a + bY
Where a and b can be found out by solving the following two normal equations simultaneously:
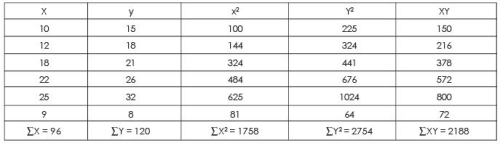
Example 15 : From the following table find :
(1) Regression Equation of X on Y.
(2) Regression Equation of Y on X.

Solution : Table : Calculation of Regression Equations
Regression equation of X on Y is given by :
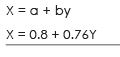
X = a + bY
Where a & b can be found out by solving the following 2 equations simultaneously –
Substituting the values obtained from the table above, we get
96 = 6a + 120 b ….(1)
2188 = 120a + 2754b ….(2)
Multiply equation 1 by 20 & subtract equation 2 from it.
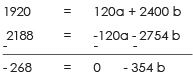

b = 0.76 Put this value of b in eq ........ (1)
96 = 6a + 120 x 0.76
96 = 6a + 91.2
6a = 96 – 91.2

Put the value a & b in the regression equation of X on Y
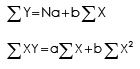
Regression equation of Yon X is given by
Y = a + bX
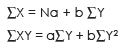
Where constants a and b can be found out by solving the following 2 normal equations simultaneously—
Substituting the value obtained from the above table, we get
120 = 6a + 96b ....(1)
2188 = 96a +1758b ....(2)
Multiply e.g. 1 by 16 & subtract equation 2 from it
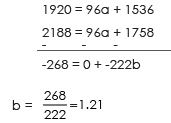
Put the value of b in equation 1
120 = 6a+ 96×1.21
120 = 6a+116.16
6a = 120 -116.16
6a = 3.84
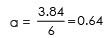
Put the value of a and 6 in the regression equation of Y on X
Y = a + bX
Y = 0.64 + 1.21X
There is an alternative method of finding the regression equations. Instead of the normal equations, deviations from the respective arithmetic mean or assumed mean are considered :
METHOD II WHEN DEVIATIONS ARE TAKEN FROM ACTUAL MEAN
Regression equation of X and Y is given by
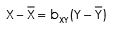
where  are actual mean of X & Y series respectively

∑XY = Sum of product of deviations taken from actual mean of X & Y.
∑Y2 = Sum of sequare of deviations from actual mean of Y.
Regression equation of Y and X is given by
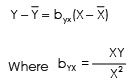
∑XY = Sum of product of deviations taken from actual mean of X & Y
∑X2 = Sum of square of deviations from actual mean of X.
Example 16 : From the data of the previous example find the two regression equation by taking deviations from actual mean.
Soluation :
Table : Calculation Regression Equations
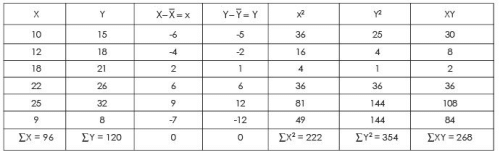

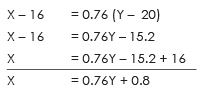
Regression equation of x on Y
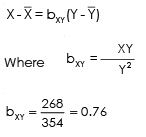
putting the value of bYX in the above equation & also put 
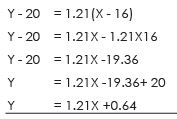
Regression equation of Y on X
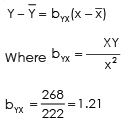
Putting the value of bYX in above equation & also put
METHOD III WHEN DEVIATIONS ARE TAKEN FROM ASSUMED MEAN
In case the actual mean of the respective series are not an integer but are in decimals, it becomes cumbersome to calculate deviations from actual mean as all the values so calculated would also be in points. In such a case deviations are taken from assumed mean to simplify the calculations.
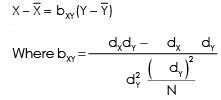
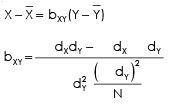
Regression equation of X on Y is given by
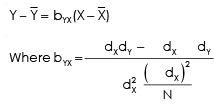
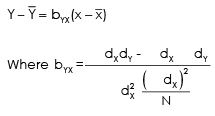
Regression equation of Y on X is given as
Example 17 :
Calculate 2 regression equations from the following table—
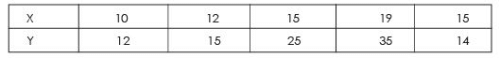
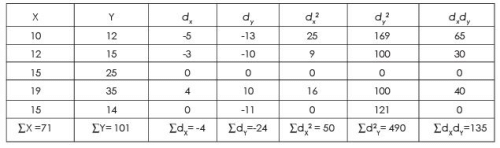
Solution : Table : Calculation Regression Equations

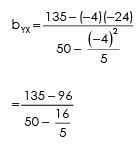
Since  are not an integer we would solve it by taking assume mean of 15 from X series, and 25 from Y series
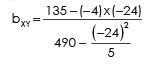
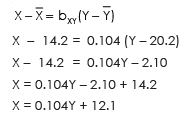
REGRESSION EQUATION OF X ON Y
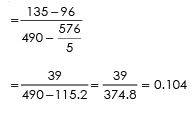
By putting the values from the above table we get
Regression equation of Yand X
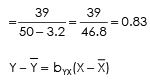
Y – 20.2 = 0.83 (X – 14.2)
Y – 20.2 = 0.83 X – 0.83 X 14.2
Y = 0.83X – 11.78 + 20.2
Y = 0.83X + 8.42
Simple Regression Analysis
While Correlation Analysis assumes no causal relationship between variables, Regression Analysis assumes that one variable is dependent upon: A) another single independent variable (Simple Regression) , or B) multiple independent variables (Multiple Regression).
Regression plots a line of best fit to the data using the least-squares method. You can see an example below of linear regression using the same car door scatter plot: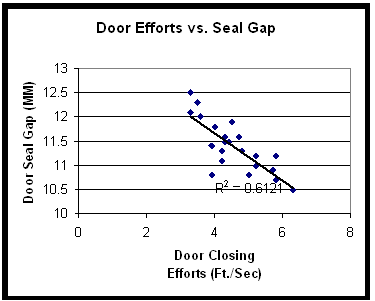
You can see that the data is clustered closely around the line, and that the line has a downward slope. There is strong negative correlation expressed by two related statistics: the r value, as stated before is, -0.78 the r2 value is therefore 0.61. R2, called the Coefficient of Determination, expresses how much of the variability in the dependent variable is explained by variability in the independent variable. You may find that a non-linear equation such as an exponential or power function may provide a better fit and yield a higher r2 than a linear equation.
These statistical calculations can be made using Excel, or by using any of several statistical analysis software packages. MoreSteam provides links to statistical software downloads, including free software.
Multiple Regression Analysis
Multiple Regression Analysis uses a similar methodology as Simple Regression, but includes more than one independent variable. Econometric models are a good example, where the dependent variable of GNP may be analyzed in terms of multiple independent variables, such as interest rates, productivity growth, government spending, savings rates, consumer confidence, etc.
Many times historical data is used in multiple regression in an attempt to identify the most significant inputs to a process. The benefit of this type of analysis is that it can be done very quickly and relatively simply. However, there are several potential pitfalls:
- The data may be inconsistent due to different measurement systems, calibration drift, different operators, or recording errors.
- The range of the variables may be very limited, and can give a false indication of low correlation. For example, a process may have temperature controls because temperature has been found in the past to have an impact on the output. Using historical temperature data may therefore indicate low significance because the range of temperature is already controlled in tight tolerance.
- There may be a time lag that influences the relationship - for example, temperature may be much more critical at an early point in the process than at a later point, or vice-versa. There also may be inventory effects that must be taken into account to make sure that all measurements are taken at a consistent point in the process.
|
1335 videos|1437 docs|834 tests
|
FAQs on Regression analysis - Correlation & Regression, Business Mathematics & Statistics - SSC CGL Tier 2 - Study Material, Online Tests, Previous Year
| 1. What is correlation and regression analysis? |  |
| 2. How is correlation coefficient calculated? | |
| 3. What does a positive correlation coefficient indicate? | |
| 4. How is regression analysis useful in business? | |
| 5. What is the difference between simple linear regression and multiple linear regression? | |


Semester Notes
,MCQs
,Viva Questions
,Objective type Questions
,ppt
,Free
,Previous Year
,Online Tests
,Online Tests
,Business Mathematics & Statistics | SSC CGL Tier 2 - Study Material
,Business Mathematics & Statistics | SSC CGL Tier 2 - Study Material
,Exam
,shortcuts and tricks
,Previous Year
,mock tests for examination
,Important questions
,Previous Year Questions with Solutions
,practice quizzes
,past year papers
,Regression analysis - Correlation & Regression
,Previous Year
,video lectures
,Regression analysis - Correlation & Regression
,Sample Paper
,Online Tests
,Regression analysis - Correlation & Regression
,study material
,Business Mathematics & Statistics | SSC CGL Tier 2 - Study Material
,Extra Questions
,Summary
;


Regression analysis - Correlation & Regression, Business Mathematics & Statistics Free PDF Download
Importance of Regression analysis - Correlation & Regression, Business Mathematics & Statistics
Regression analysis - Correlation & Regression, Business Mathematics & Statistics Notes
Regression analysis - Correlation & Regression, Business Mathematics & Statistics SSC CGL Questions
Study Regression analysis - Correlation & Regression, Business Mathematics & Statistics on the App
|
© EduRev
|
Education Revolution
|


|


