Characterisation of Inorganic Compounds by Infrared (IR) Spectroscopy, CSIR - NET - Government Jobs PDF Download

Spectroscopy in Inorganic Chemistry (Theory)
Introduction
Spectroscopy is the study of the interaction of electromagnetic radiation with matter. Spectroscopy has many applications in the modern world, ranging from nondestructive examination of materials to medical diagnostic imaging (e.g., MRIs, CAT scans). In a chemical context, spectroscopy is used to study energy transitions in atoms and molecules. The transitions are interpreted and can serve to identify the molecule or give clues about the molecular structure. Spectroscopy is a powerful tool for inorganic chemists to help identify the compounds that have been prepared. Problem solving plays a crucial role in the interpretation of spectra, and you will find that your deductive reasoning skills will be challenged as you apply the principles of spectroscopy to solving chemical problems.
When a molecule interacts with electromagnetic radiation, energy is absorbed and the molecule is promoted, or is said to undergo a transition, to a higher energy state (excited state). In order for absorption to occur, the energy of the radiation must match the energy difference between the quantized energy levels of the molecule. For example, in Figure 1, E1 and E2 are the quantized energy levels and ΔE is the energy difference (ΔE = E2 - E1) that must match the energy of the incident radiation.
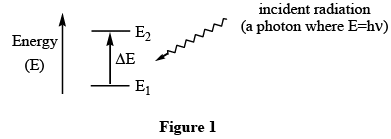
As the equation accompanying Figure 1 shows, radiation can be characterized by its frequency (ν), its wavelength (λ), or its wavenumber  . The relationships between these quantities are:
Although the wavenumber (cm-1) is not an S.I. unit, it is conventionally used to describe the transitions in infrared (IR) spectroscopy, which we shall discuss in a moment. The unit of frequency, s-1 ("per second"), is known as a hertz (Hz). This unit is sometimes convenient for very low energy transitions, such as in nuclear magnetic resonance (NMR) spectroscopy. In general, an absorption spectrum is obtained by recording the amount of radiation absorbed by the sample as a function of the frequency or wavelength of the incident radiation. Each type of spectroscopy focuses upon a specific region of the electromagnetic spectrum (Figure 2). We will be primarily interested with infrared (IR) (4000 - 200 cm-1) and nuclear magnetic resonance (NMR) (10 - 900 MHz) spectroscopies.
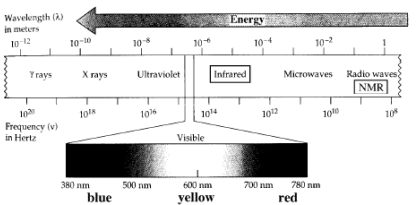
Figure 2. The electromagnetic spectrum
A. Infrared (IR) Spectroscopy
Introduction
Infrared spectroscopy is used to study the vibrational motions of molecules. As shall be described shortly, it turns out that different motions among different groups of atoms cause the molecule to absorb different amounts of energy. Studying these transitions can sometimes allow us to determine what kinds of atoms are bonded or grouped in an unknown compound, which in turn gives clues as to the molecular structure.
| IR spectroscopy ⇒ identifying how certain atoms are bonded to each other or how they are grouped in a molecule |
Theory (WWW)
Absorption of energy in the infrared region  = 4000 - 200 cm-1) arises from changes in the vibrational energy of the molecules. There are two types of vibrations that cause absorptions in an IR spectrum. Stretching involves rhythmical displacement along the bond axis such that the interatomic distance alternately increases and decreases (Figure 3a). Bending involves a change in bond angles between two bonds and an atom common to both (Figure 3b).
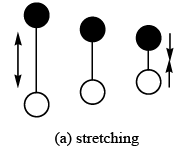
Figure 3. Stretching and Bending Vibrations.
For example, the borohydride anion (BH4-) has two vibrational modes that can be detected by IR spectroscopy (Figure 4).
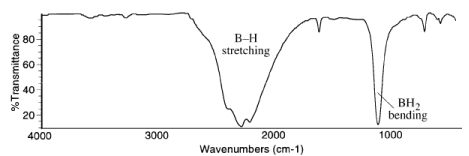
Figure 4. Infrared spectrum of NaBH4 (KBr pellet).
One important condition is that only those vibrations that produce a change in the electric dipole moment of the molecule will be observed in the infrared spectrum. For example, stretching vibrations in homonuclear diatomic molecules like O2, N2, and Br2 do not produce a change in dipole moment and hence these molecules do not give rise to an IR spectrum. On the other hand, CO and IBr produce IR spectra because these molecules contain a permanent dipole moment that will change as the bond is stretched or compressed. CO2, a linear molecule that does not have a permanent electric dipole, nevertheless produces an IR spectrum because the two C=O bonds can stretch in an asymmetric fashion and also bend to produce changes in the dipole moment (Figure 5 ). The symmetric stretch is not observed in the IR spectrum because it produces no change in the electric dipole moment, just as for homonuclear diatomics such as N2.
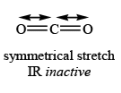
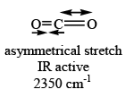
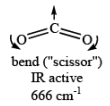
Figure 5. Stretching and Bending Vibrations in CO2
An additional example is provided by the acetate ion, CH3CO2-. In this case, the C–O vectors are not collinear, and both symmetrical and asymmetrical stretches are observed in the IR spectrum.
The stretching of a bond can be likened to the stretching of a spring, with the energy changes being detected by absorptions of IR radiation. While we will be treating IR spectroscopy from a qualitative standpoint, it is important to understand a few of the fundamental physical properties that determine the position of an absorption band in the IR spectrum. The following equation, derived from Hooke’s law, describes the relationship between the frequency of oscillation , the atomic masses (mx and my), and the force constant of the bond (k).

where 
The force constant, k, approximates the strength of the bond being stretched between two atoms. Thus, the stretching frequency of the C≡O triple bond (2143 cm-1) of carbon monoxide is higher than that of the C=O double bond in a ketone (1850 - 1650 cm-1), which in turn is higher than that of a C–O single bond (1200 - 1000 cm-1). Note that in the previous three examples, the atoms (and thus mx and my) were kept constant and only k was varied.
However, an equally important component is the reduced mass, �, which describes how the frequency will change as the masses of the two atoms change. This helps us understand why C–H stretches occur at higher frequency (3350 - 2850 cm-1) than the C≡O triple bond (2143 cm-1) of carbon monoxide even though the C≡O triple bond is a much stronger bond than the C–H single bond. The reduced mass of a C–H bond (� = (12 � 1)/(12 + 1) = 0.92) is much smaller than that of the C≡O bond (� = (12 � 16)/(12 + 16) = 6.86) and consequently leads to a larger frequency when inserted into the denominator of Hooke’s law. Although Hooke’s law demonstrates some of the fundamental features of IR spectroscopy, we will be interested primarily in qualitative applications. (Hint: although you will never be asked to perform a calculation involving Hooke’s law, you should understand the factors that influence
In theory, it is possible to predict the number of fundamental vibrations that will be observed in an IR spectrum.* In practice, IR spectra are more complicated that we might have expected. The infrared spectrum of gaseous BF3 (Figure 6) provides an illustration of this. It turns out that trigonal planar molecules have four normal modes of vibration, three of which are IR active.1,2 (Why is the “breathing” (ν1) mode not IR active?) The B–F stretching (ν3) and outof-plane B–F bending modes (ν2) occur at approximately 1500 and 700 cm-1, respectively. The in-plane bending mode, while IR active, is too low in energy to be observed in the IR region shown in Figure 6 (ν4 = 481 cm-1).
One complication that is immediately apparent is the fact that two B–F stretches are observed at ν3 where we might have expected to see only one. This occurs because boron is composed of two isotopes: 10B (19.9% natural abundance) and 11B (80.1% natural abundance).
Therefore, a 10B –19F bond will have a different reduced mass (� = (10 � 19)/(10 + 19) = 6.55) and a different stretching frequency than a 11B–19F bond (� = (11 � 19)/(11 + 19) = 6.97). The higher frequency band can be assigned to the 10B–19F stretch on the basis of its lower intensity (because of 10B’s lower natural abundance), and this can be confirmed by applying Hooke’s law:
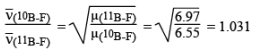
and 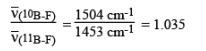
The two ratios agree to within � 0.4 %, confirming our assignment. As another illustration of the effect of changing �, the 10B–Cl and 11B–Cl stretches in BCl3 occur at 995 and 956 cm-1, respectively.
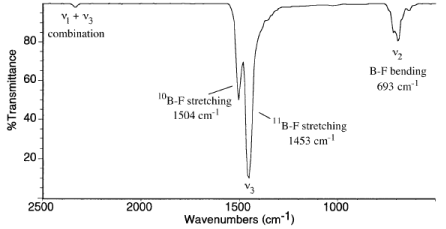
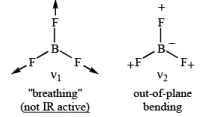
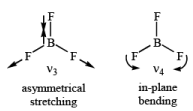
Figure 6. IR spectrum and fundamental vibrational modes of BF3.
The second complication is the weak band at approximately 2330 cm-1 that is not the result of a fundamental vibration. Most IR spectra will show many more than the number of bands predicted from a knowledge of the fundamental vibrational modes. Overtones occur when a vibrational mode is excited beyond the first excited state; the energy of the overtone band will therefore be higher than that of the fundamental and is often roughly equal to some multiple of the fundamental frequency. Combinations occur when more than one vibration is excited by the absorption of one photon. Combination bands occur at frequencies that are approximately equal to the sum of the two component vibrations. The band at ~2330 cm-1 in the IR spectrum of BF3 has been assigned to a ν1 + ν3 combination. Overtone and combination bands are seldom assigned in the qualitative analysis of IR spectra as their intensities are typically much weaker than those of fundamental vibrations. It is, nevertheless, important to remember their contribution to the appearance of IR spectra.
The previous example demonstrated that even the IR spectra of relatively small molecules can be quite complicated. Since we will usually be dealing with relatively large molecules, there are numerous possible stretching and bending motions and consequently a large number of infrared bands are usually observed in a particular spectrum. Assigning every band in the spectrum to a particular vibration is virtually impossible using qualitative techniques. Nevertheless, the IR spectrum of a molecule is very informative and can be used in the following ways:
(a) To identify the presence (or absence) of functional groups.
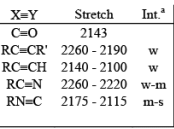
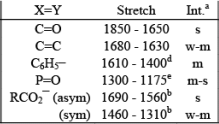
The vibrations of certain functional groups (e.g., C–H stretch, C=O stretch, P–H stretch, etc.) give rise to bands in well-defined frequency ranges regardless of the type of molecule that contains them. That is, their position is not greatly influenced by other atoms in the molecule. A listing of some group vibrations is provided in Tables 1 and 2 and Figure 7. Functional groups within a molecule can be identified by comparing the bands observed in an IR spectrum with the frequency ranges in the correlation tables and figures. Remember that the ranges and intensities provided are guidelines, not hard and fast rules.
(b) As a fingerprint for molecule identification.
An unknown compound can be identified by matching its IR spectrum with that of a known compound. This type of analysis can be accomplished by a computer search of data banks of IR spectra of known compounds. The region below ~1500 cm-1 in an IR spectrum is particularly useful in this type of search, and is commonly referred to as the “fingerprint region”. Because of the complexity of this part of the spectrum, you will be told when you should attempt assignments within the fingerprint region.
Table 1. IR Stretching Frequencies for Some Group Vibrations (cm-1)
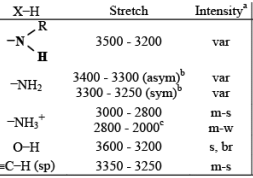
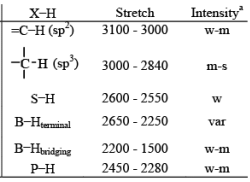
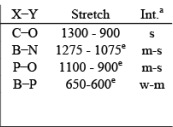
a Intensities: s = strong, m = medium, w = weak, br = broad, var = varies. These intensities serve as a guide only; remember that frequency is much more diagnostic.
b Two bands are observed for this group; asym = asymmetric, sym = symmetric.
c In salts of primary amines, the 2800-2000 cm-1 region consists of several combination bands.
d Refers to carbon-carbon stretching in the aromatic ring; weak overtone bands are commonly observed between 2000 - 1650 cm-1 when phenyl groups are present.
e In practice, these functional groups span a larger frequency range than is indicated. The range provided reflects the types of compounds encountered in our courses.
Table 2. IR Bending Frequencies for Some Group Vibrations (cm-1).3,4
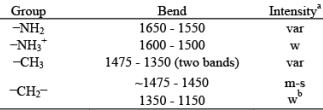
a Intensities: s = strong, m = medium, w = weak, br = broad, var = varies. These intensities serve as a guide only; remember that frequency is much more diagnostic.
b These bands are often obscured by stronger absorptions from other functional groups.
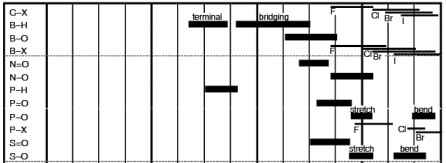
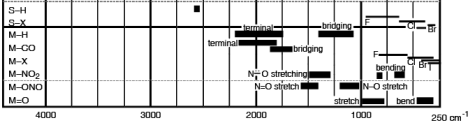
Figure 7. Characteristic Inorganic Group Vibrations
FAQs on Characterisation of Inorganic Compounds by Infrared (IR) Spectroscopy, CSIR - NET - Government Jobs
| 1. What is the principle behind characterizing inorganic compounds using infrared (IR) spectroscopy? |  |
| 2. How does infrared (IR) spectroscopy help in the characterization of inorganic compounds? | |
| 3. What are the limitations of infrared (IR) spectroscopy in characterizing inorganic compounds? | |
| 4. How is infrared (IR) spectroscopy performed for characterizing inorganic compounds? | |
| 5. What are the applications of infrared (IR) spectroscopy in characterizing inorganic compounds? | |


Semester Notes
,Sample Paper
,Free
,Viva Questions
,Objective type Questions
,Characterisation of Inorganic Compounds by Infrared (IR) Spectroscopy
,Extra Questions
,CSIR - NET - Government Jobs
,Exam
,practice quizzes
,study material
,Previous Year Questions with Solutions
,Characterisation of Inorganic Compounds by Infrared (IR) Spectroscopy
,mock tests for examination
,video lectures
,Important questions
,shortcuts and tricks
,CSIR - NET - Government Jobs
,Characterisation of Inorganic Compounds by Infrared (IR) Spectroscopy
,MCQs
,past year papers
,ppt
,Summary
,CSIR - NET - Government Jobs
;


Characterisation of Inorganic Compounds by Infrared (IR) Spectroscopy, CSIR - NET Free PDF Download
Importance of Characterisation of Inorganic Compounds by Infrared (IR) Spectroscopy, CSIR - NET
Characterisation of Inorganic Compounds by Infrared (IR) Spectroscopy, CSIR - NET Notes
Characterisation of Inorganic Compounds by Infrared (IR) Spectroscopy, CSIR - NET Government Jobs Questions
Study Characterisation of Inorganic Compounds by Infrared (IR) Spectroscopy, CSIR - NET on the App
|
© EduRev
|
Education Revolution
|


|


