Class 10 Exam  >  Class 10 Notes  >  NCERT Textbooks & Solutions for Class 10  >  NCERT Solutions: Statistics (Exercise 13.2)

NCERT Solutions for Class 10 Maths Chapter 13 - Statistics (Exercise 13.2)

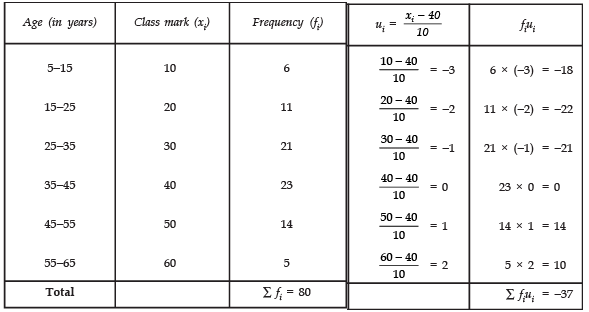
Q1: The following table shows the ages of the patients admitted in a hospital during a year:
NCERT Solutions for Class 10 Maths Chapter 13 - Statistics (Exercise 13.2)
Find the mode and the mean of the data given above. Compare and interpret the two measures of central tendency.
Sol: Mode:
Here, the highest frequency is 23.
The frequency 23 corresponds to the class interval 35 − 45.
∴ The modal class is 35 − 45
Now, Class size (h) = 10
Lower limit (l) = 35 Frequency of the modal class (f1) = 23
Frequency of the class preceding the modal class f0 = 21
Frequency of the class succeeding the modal class f2 = 14
NCERT Solutions for Class 10 Maths Chapter 13 - Statistics (Exercise 13.2)
Mean
Let assumed mean a = 40
∵  h = 10

NCERT Solutions for Class 10 Maths Chapter 13 - Statistics (Exercise 13.2)

NCERT Solutions for Class 10 Maths Chapter 13 - Statistics (Exercise 13.2)
∴ Required mean = 35.37 years.

Q2: The following data gives the information on the observed lifetimes (in hours) of 225 electrical components:
NCERT Solutions for Class 10 Maths Chapter 13 - Statistics (Exercise 13.2)
Determine the modal lifetimes of the components.
Sol: Here, the highest frequency = 61.
∵ The frequency 61 corresponds to class 60 − 80
∴ The modal class = 60 − 80
∴ We have: l = 60
h = 20
f1 = 61
f0 = 52
f2 = 38
NCERT Solutions for Class 10 Maths Chapter 13 - Statistics (Exercise 13.2)
Thus, the required modal life times of the components are 65.625 hours.

Q3: The following data gives the distribution of total monthly household expenditure of 200 families of a village. Find the modal monthly expenditure of the families. Also, find the mean monthly expenditure:
NCERT Solutions for Class 10 Maths Chapter 13 - Statistics (Exercise 13.2)
Sol: Mode: 
∵ The maximum number of families 40 have their total monthly expenditure is in interval 1500−2000.
∴ Modal class is 1500−2000.
l = 1500, h = 500
f1 = 40,   f0 = 24
f2 = 33
NCERT Solutions for Class 10 Maths Chapter 13 - Statistics (Exercise 13.2)
Thus, the required modal monthly expenditure of the families is Rs 1847.83.
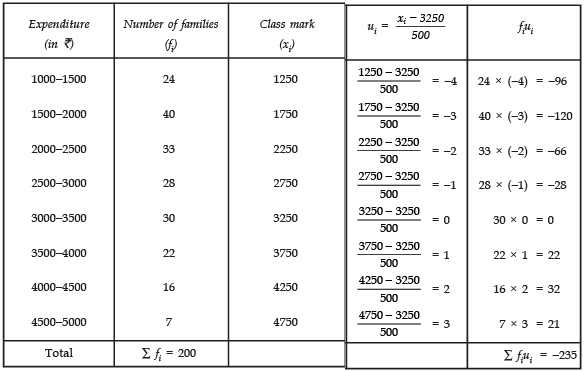
Mean: Let assumed mean (a) = 3250
∵ h = 500
∴ We have the following table:NCERT Solutions for Class 10 Maths Chapter 13 - Statistics (Exercise 13.2)
NCERT Solutions for Class 10 Maths Chapter 13 - Statistics (Exercise 13.2)
Thus, the mean monthly expenditure = Rs 2662.50.

Q4: The following distribution gives the state-wise teacher-student ratio in higher secondary schools of India. Find the mode and mean of this data. Interpret the two measures.
NCERT Solutions for Class 10 Maths Chapter 13 - Statistics (Exercise 13.2)
Sol: Mode: 
Since the class 30 − 35 has the greatest frequency and h = 5
l = 30
f1 = 10
f0 = 9
f2 = 3
NCERT Solutions for Class 10 Maths Chapter 13 - Statistics (Exercise 13.2)
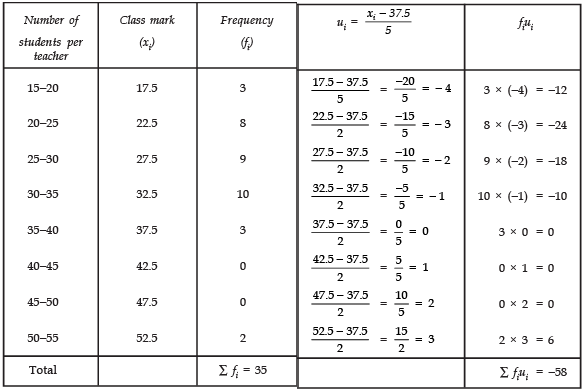
Mean:
Let the assumed mean (a) = 37.5
Since, h = 5
∴ We have the following table:
NCERT Solutions for Class 10 Maths Chapter 13 - Statistics (Exercise 13.2)

NCERT Solutions for Class 10 Maths Chapter 13 - Statistics (Exercise 13.2)
Thus ,the required mean is 29.2

Q5: The given distribution shows the number of runs scored by some top batsmen of the world in one-day international cricket matches.
NCERT Solutions for Class 10 Maths Chapter 13 - Statistics (Exercise 13.2)
Find the mode of the data.
Sol: The class 4000−5000 has the highest frequency i.e., 18
∴ h = 1000
l = 4000
f1 = 18
f0 = 4
f2 = 9
Now,
NCERT Solutions for Class 10 Maths Chapter 13 - Statistics (Exercise 13.2)
Thus, the required mode is 4608.7.

Q6: A student noted the number of cars passing through a spot on a road for 100 periods each of 3 minutes and summarised it in the table given below. Find the mode of the data:
NCERT Solutions for Class 10 Maths Chapter 13 - Statistics (Exercise 13.2)
Sol: ∵ The class 40 − 50 has the maximum frequency i.e., 20
∴ f1 = 20,
f0 = 12,
f2 = 11 and h = 10
Also
l = 40
NCERT Solutions for Class 10 Maths Chapter 13 - Statistics (Exercise 13.2)
= 40 + 4.7 = 44.7
Thus, the required mode is 44.7

The document NCERT Solutions for Class 10 Maths Chapter 13 - Statistics (Exercise 13.2) is a part of the Class 10 Course NCERT Textbooks & Solutions for Class 10.
All you need of Class 10 at this link: Class 10
342 docs

Top Courses for Class 10

FAQs on NCERT Solutions for Class 10 Maths Chapter 13 - Statistics (Exercise 13.2)

1. What is the importance of statistics in our daily lives?
Ans. Statistics plays a crucial role in our daily lives as it helps us make informed decisions and understand trends and patterns in various fields. For example, it helps in analyzing market trends for business decisions, understanding public opinion through surveys, and interpreting medical research data for healthcare decisions.
2. How is statistics used in the field of economics?
Ans. Statistics is extensively used in economics to analyze and interpret economic data. It helps economists in forecasting future trends, measuring economic indicators like GDP and inflation, and conducting economic research. By using statistical techniques, economists can make predictions and formulate effective policies for economic growth and development.
3. What are the different types of data in statistics?
Ans. In statistics, data can be classified into two main types: qualitative data and quantitative data. Qualitative data consists of non-numerical information like names, colors, or opinions. On the other hand, quantitative data represents numerical values and can be further categorized into discrete data (whole numbers) and continuous data (measurable quantities).
4. How can statistics be used in the field of education?
Ans. Statistics has various applications in the field of education. It helps in analyzing student performance, evaluating the effectiveness of teaching methods, and identifying areas for improvement. By using statistical techniques, educators can make data-driven decisions to enhance the learning experience and ensure the success of students.
5. What is the difference between descriptive and inferential statistics?
Ans. Descriptive statistics involves summarizing and presenting data using measures such as mean, median, and mode. It provides a clear understanding of the data and helps in describing the characteristics of a population or sample. On the other hand, inferential statistics involves making inferences and drawing conclusions about a population based on a sample. It uses techniques such as hypothesis testing and confidence intervals to make predictions or generalizations.
342 docs
Download as PDF
Explore Courses for Class 10 exam

Top Courses for Class 10

Signup for Free!
Signup to see your scores go up within 7 days! Learn & Practice with 1000+ FREE Notes, Videos & Tests.
10M+ students study on EduRev
Related Searches

Important questions

,

Exam

,

Objective type Questions

,

NCERT Solutions for Class 10 Maths Chapter 13 - Statistics (Exercise 13.2)

,

pdf

,

mock tests for examination

,

NCERT Solutions for Class 10 Maths Chapter 13 - Statistics (Exercise 13.2)

,

study material

,

Summary

,

Viva Questions

,

NCERT Solutions for Class 10 Maths Chapter 13 - Statistics (Exercise 13.2)

,

ppt

,

Sample Paper

,

Semester Notes

,

Free

,

Previous Year Questions with Solutions

,

shortcuts and tricks

,

Extra Questions

,

past year papers

,

practice quizzes

,

video lectures

,

MCQs

;