Class 10 Maths Chapter 13 Question Answers - Statistics

II. SHORT ANSWER TYPE QUESTIONS
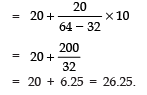
Q1. Find the mode of the data:
Marks | 0-10 | 10-20 | 20-30 | 30-40 | 40-50 |
No. of students | 3 | 12 | 32 | 20 | 6 |
Sol. Here, modal class is 20–30
f1 = 32, f2 = 20 and f0 = 12
Since, the lower limit of the modal class
l = 20
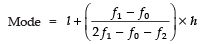
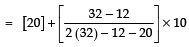 [∵ h = 10]
Q2. The percentage marks obtained by 100 students in an examination are given below:
Marks | 30-35 | 35-40 | 40-45 | 45-50 | 50-55 | 55-60 | 60-65 |
Frequency | 10 | 16 | 18 | 23 | 18 | 8 | 7 |
Find the median from the above data.
Sol. We have:
Marks | Frequency | cf |
30-35 | 10 | 10 + 0 = 10 |
35-40 | 16 | 16 + 10 = 26 |
40-45 | 18 | 18 + 26 = 44 |
45-50 | 23 | 23 + 44 = 67 |
50-55 | 18 | 18 + 67 = 85 |
55-60 | 8 | 8 + 85 = 93 |
60-65 | 7 | 7 + 93 = 100 |
Here, 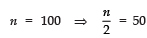
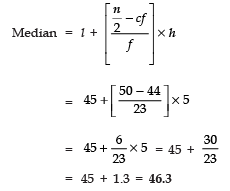
∴ The median class is 45−50, such that
l = 45, cf = 44, f = 23 and h = 5
Q3. Write a frequency distribution table for the following data:
Marks | Above 0 | Above 10 | Above 20 | Above 30 | Above 40 | Above 50 |
No. of students | 30 | 28 | 21 | 15 | 10 | 0 |
Sol. Since,
30 − 28 = 2
28 − 21 = 7
21 − 15 = 6
15 − 10 = 5
10 − 0 =10
The required frequency distribution is:
Marks | Number of students |
0-10 | 2 |
10-20 | 7 |
20-30 | 6 |
30-40 | 5 |
40-50 | 10 |
Total | 30 |
Q4. Find the median of the following data:
Class interval | 0-20 | 20-40 | 40-60 | 60-80 | 80-100 | 100-120 |
Frequency | 7 | 8 | 12 | 10 | 8 | 5 |
Sol.
Class Interval | Frequency | Cumulative frequency |
0-20 | 7 | 7 |
20-40 | 8 | 15 |
40-60 | 12 | 27 |
60-80 | 10 | 37 |
80-100 | 8 | 45 |
100-120 | 5 | 50 |
Total | 50 |
|
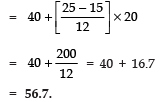
∵ Median class is 40–60 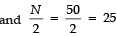
∴ l = 40, f = 12, CF = 15 and h = 20
Since, 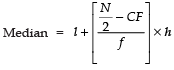
|
127 videos|584 docs|79 tests
|
FAQs on Class 10 Maths Chapter 13 Question Answers - Statistics
| 1. What is statistics? |  |
| 2. What are the different types of data in statistics? | |
| 3. How do you calculate the mean, median, and mode? | |
| 4. What is the difference between correlation and causation? | |
| 5. How can statistics be used in real life? | |


Previous Year Questions with Solutions
,mock tests for examination
,Viva Questions
,practice quizzes
,study material
,Free
,Class 10 Maths Chapter 13 Question Answers - Statistics
,Summary
,ppt
,past year papers
,Class 10 Maths Chapter 13 Question Answers - Statistics
,Class 10 Maths Chapter 13 Question Answers - Statistics
,Extra Questions
,Important questions
,Objective type Questions
,video lectures
,Exam
,shortcuts and tricks
,MCQs
,Semester Notes
,Sample Paper
;


Short Answer Questions: Statistics Free PDF Download
Importance of Short Answer Questions: Statistics
Short Answer Questions: Statistics Notes
Short Answer Questions: Statistics Class 10
Study Short Answer Questions: Statistics on the App
|
© EduRev
|
Education Revolution
|


|


