Short Answer Questions: Statistics

Short Answer Type Questions
Q1. Find the mode of the data:
Marks | 0-10 | 10-20 | 20-30 | 30-40 | 40-50 |
No. of students | 3 | 12 | 32 | 20 | 6 |
Ans: Modal class is 20-30.
f1 = 32, f0 = 12 and f2 = 20.
Lower limit l = 20.
[∵ h = 10]
Use the formula for mode in grouped data:
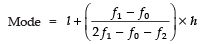
Mode = l + [(f1 - f0)/(2f1 - f0 - f2)] × h.
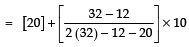
Numerator = 32 - 12 = 20.
Denominator = 2 × 32 - 12 - 20 = 64 - 32 = 32.
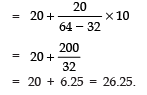
Fraction = 20/32 = 0.625.
Mode = 20 + 0.625 × 10 = 20 + 6.25 = 26.25.
Therefore, Mode ≈ 26.25 marks.
Q2. The percentage marks obtained by 100 students in an examination are given below:
Marks | 30-35 | 35-40 | 40-45 | 45-50 | 50-55 | 55-60 | 60-65 |
Frequency | 10 | 16 | 18 | 23 | 18 | 8 | 7 |
Find the median from the above data.
Ans: Total number of observations n = 100, so n/2 = 50.
Marks | Frequency | cf |
30-35 | 10 | 10 + 0 = 10 |
35-40 | 16 | 16 + 10 = 26 |
40-45 | 18 | 18 + 26 = 44 |
45-50 | 23 | 23 + 44 = 67 |
50-55 | 18 | 18 + 67 = 85 |
55-60 | 8 | 8 + 85 = 93 |
60-65 | 7 | 7 + 93 = 100 |
Here,
From the cumulative frequencies the median class is 45-50 (first class with cf ≥ 50).
So l = 45, cf = 44 (cumulative frequency before the median class), f = 23 and h = 5.
Use the formula for median in grouped data:
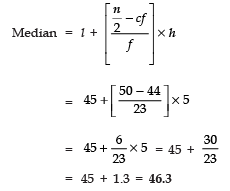
Median = l + [(n/2 - cf)/f] × h.
n/2 - cf = 50 - 44 = 6.
(n/2 - cf)/f = 6/23 ≈ 0.26087.
Multiply by h: 0.26087 × 5 ≈ 1.30435.
Median = 45 + 1.30435 = 46.30435.
Therefore, Median ≈ 46.30%.
Q3. Write a frequency distribution table for the following data:
Marks | Above 0 | Above 10 | Above 20 | Above 30 | Above 40 | Above 50 |
No. of students | 30 | 28 | 21 | 15 | 10 | 0 |
Ans: To find the frequency in each class, subtract successive 'above' values (Above a - Above b gives number in the class a-b).
30 - 28 = 2
28 - 21 = 7
21 - 15 = 6
15 - 10 = 5
10 - 0 = 10
These are the frequencies for 0-10, 10-20, 20-30, 30-40 and 40-50 respectively.
The required frequency distribution is:
Marks | Number of students |
0-10 | 2 |
10-20 | 7 |
20-30 | 6 |
30-40 | 5 |
40-50 | 10 |
Total | 30 |
Q4. Find the median of the following data:
Class interval | 0-20 | 20-40 | 40-60 | 60-80 | 80-100 | 100-120 |
Frequency | 7 | 8 | 12 | 10 | 8 | 5 |
Ans:
Class Interval | Frequency | Cumulative frequency |
0-20 | 7 | 7 |
20-40 | 8 | 15 |
40-60 | 12 | 27 |
60-80 | 10 | 37 |
80-100 | 8 | 45 |
100-120 | 5 | 50 |
Total | 50 |
∵ Median class is 40-60
So total n = 50 and n/2 = 25.
Thus l = 40, cf = 15 (cumulative frequency before the median class), f = 12 and h = 20.
Use the formula:
Median = l + [(n/2 - cf)/f] × h.
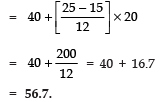
n/2 - cf = 25 - 15 = 10.
(n/2 - cf)/f = 10/12 = 0.83333.
Multiply by h: 0.83333 × 20 = 16.6667.
Median = 40 + 16.6667 = 56.6667.
Therefore, Median ≈ 56.67 marks.
FAQs on Short Answer Questions: Statistics
| 1. What is statistics? |  |
| 2. What are the different types of data in statistics? | |
| 3. How do you calculate the mean, median, and mode? | |
| 4. What is the difference between correlation and causation? | |
| 5. How can statistics be used in real life? | |


