Class 10 Maths Chapter 13 Question Answers - Statistics

III. LONG ANSWER TYPE QUESTIONS
Q1. The median of the following frequency distribution is 35. Find the value of x.
Class Interval | Frequency | Cumulative frequency |
0-20 | 7 | 7 |
20-40 | 8 | 15 |
40-60 | 12 | 27 |
60-80 | 10 | 37 |
80-100 | 8 | 45 |
100-120 | 5 | 50 |
Total | 50 |
|
Also find the modal class.
Sol. Let us prepare the cumulative frequency table:
Class intervals | f | cf |
0-10 | 2 | 2 + 0 = 2 |
10-20 | 3 | 2 + 3 = 5 |
20-30 | x | 5 + x = (5 + x) |
30-40 | 6 | (5 + x) + 6 = 11 + x |
40-50 | 5 | (11 + x) + 5 = 16 + x |
50-60 | 3 | (16 + x) + 3 = 19 + x |
60-70 | 2 | (19 + x) + 2 = 21 + x |
Total | (21 + x) |
|
Here, 
Obviously,  lies in the class interval 30−40.
∴
l = 30, Cf = x + 5, f = 6 and h = 10
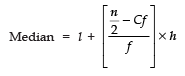
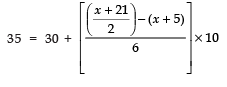
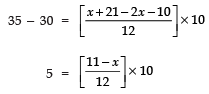
⇒ 5 × 12 = 110 − 10x
⇒ 10x = 110 − 60
⇒ 10x =50 ⇒ x = 5
(i) ∴ The required value of x is 5.
(ii) ∵ The maximum frequency is 6
∴ The modal class is 30−40.
Q2. The mean of the following data is 53, find the missing frequencies.
Age (in years) | 0-20 | 20-40 | 40-60 | 60-80 | 80-100 | Total |
Number of people | 15 | f | 21 | f2 | 17 | 100 |
Sol.
Age (in years) | Number of People (fi) | Mid value (xi) | fi × xi |
0-20 | 15 | 10 | 15 x 10 = 150 |
20-40 | fa | 30 | f1 x 30 = 30 f1 |
40-60 | 21 | 50 | 21 x 50 = 1050 |
60-80 | f2 | 70 | h x 70 = 70 f2 |
80-100 | 17 | 90 | 17 x 90 = 1530 |
Total | 100 |
| 2730 + 30 f1 + 70 f2 |
Since, 15 + f1 + 21 + f2 + 17 = 100
∴ 53 + (f1 + f2) = 100
⇒ f1 + f2 = 100 − 53 = 47 ...(1)

⇒ 2730 + 30 f1 + 70 f2 = 5300
⇒ 30 f1 + 70 f2 = 5300 − 2730 = 2570
⇒ 3 f1 + 7 f2 = 257
⇒ 3 (47 − f2) + 7 f2 = 257 |∵ f1 = 47 − f2
⇒ 141 − 3 f2 + 7 f2 = 257
⇒ 4 f2 = 116 or f2 = 29
∴ f1 = 41 − 29 = 18
Thus, f1 = 18 and f2 = 29.
Q3. The mean of the following distribution is 18.
Class interval | 11-13 | 13-15 | 15-17 | 17-19 | 19-21 | 21-23 | 23-25 |
Frequencies | 3 | 6 | 9 | 13 | f | 5 | 4 |
Find f
Sol. Let the assumed mean (a) = 18

∴ We have the following table:
| Class interval | xi | fi |  | fi ui |
11-13 | 12 | 3 | -3 | 3 x (-3) = -9 |
13-15 | 14 | 6 | -2 | 6 x (-2) = -12 |
15-17 | 16 | 9 | -1 | 9 x (-1) = -9 |
17-19 | 18 | 13 | 0 | 13 x 0 = 0 |
19-21 | 20 | f | 1 | f x 1 = f |
21-23 | 22 | 5 | 2 | 5 x 2 = 10 |
23-25 | 24 | 4 | 3 | 3 x 3 = 9 |
|
| ∑ fi = 40 + f |
| ∑fi ui = f− 8 |

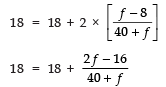
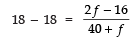
⇒ 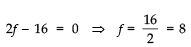
Thus, the required frequency = 8
Q4. The percentage of marks obtained by 100 students in an examination are given below:
Marks | 30 - 35 | 35 - 40 | 40 - 45 | 45 - 50 | 50 -55 | 55 - 60 | 60-65 |
Frequency | 14 | 16 | 18 | 23 | 18 | 8 | 3 |
Find the median of the above data.
Sol.
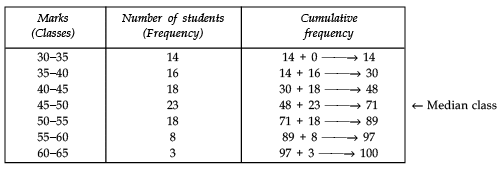
Here n = 100 ⇒ n/2 = 50, which lies in the class 45 – 50, where
l1 (lower limit of the median – class) = 45
c (The cumulative frequency of the class preceding the median class) = 48
f (The frequency of the median class) = 23
h (The class size) = 5


∴ The median percentage of marks is 45.4.
Q5. The median of the distribution given below is 14.4. Find the values of x and y, if the total frequency is 20.
Class interval | 0 - 6 | 6 -12 | 12 -18 | 18 - 24 | 24 - 30 |
Frequency | 4 | x | 5 | y | 1 |
Sol.
Class interval | Frequency | Cumulative Frequency |
0-6 | 4 | 4 + 0 = 4 |
6-12 | x | 4 + x = (4 + x) |
12-18 | 5 | 5 + (4 + x) = 9 + x |
18-24 | y | y + (9 + x) = 9 + x + y |
24-30 | 1 | 1 + (9 + x + y) = 10 + x + y |
Since, n = 20
∴ 10 + x + y = 20
⇒ x + y = 20 − 10
⇒ x + y = 10. ...(1)
Also, we have
Median = 14.4,
which lies in the class interval 12−18.
∴ The median class is 12−18, such that
l = 12, f = 5, Cf = 4 + x and h = 6
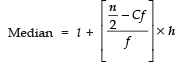
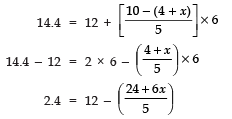

⇒ 24 + 6x = (9.6) × 5
⇒ 24 + 6x =48
⇒ 6 x = 48 − 24 = 24
⇒ x = 24/6 = 4
Now, from (1), we have:
x + y = 10
⇒ 4 + y = 10
⇒ y = 10 − 4 = 6
Thus, x =4 and y = 6
Q6. The distribution below gives the weights of 30 students of a class. Find the mean and the median weight of the students:
Weight (in kg) | Number of students |
40-45 | 2 |
45-50 | 3 |
50-55 | 8 |
55-60 | 6 |
60-65 | 6 |
65-70 | 3 |
70-75 | 2 |
Sol. Let the assumed mean, a = 57.5
∴ h = 5
∴ 
We have the following table:
Weight of students | Class mark | Frequency fi | Cumulative frequency |
| fi ui |
|
|
|
|
|
|
40-45 | 42.5 | 2 | 2 + 0 = 2 | -3 | -6 |
45-50 | 47.5 | 3 | 2 + 3 = 5 | -2 | -6 |
50-55 | 52.5 | 8 | 5 + 8 = 13 | -1 | -8 |
55-60 | 57.5 | 6 | 13 + 6 = 19 | 0 | 0 |
60-65 | 62.5 | 6 | 19 + 6 = 25 | 1 | 6 |
65-70 | 67.5 | 3 | 25 + 3 = 28 | 2 | 6 |
70-75 | 72.5 | 2 | 28 + 2 = 30 | 3 | 6 |
Total |
| ∑ fi = 30 |
|
| ∑fiui = - 2 |

∴ The mean of the given data 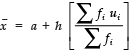
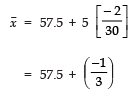
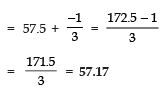
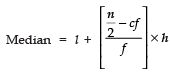
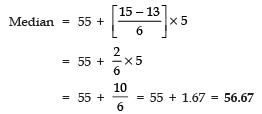
For finding the median:
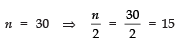
And it lies in the class 55–60.

Q7. The lengths of 40 leaves of a plant are measured correct upto the nearest millimetre and the data is as under:
Length (in mm) | Numbers of Leaves |
118-126 | 4 |
126-134 | 5 |
134-142 | 10 |
142-150 | 12 |
150-158 | 4 |
158-166 | 5 |
Find the mean and median length of the leaves.
Sol. For finding the mean:
Let the assumed mean a = 146
h = 8
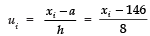
Now, we have the following table:
| Length (in mm) | Class mark (xi) | Frequency (fi) | Cumulative frequency Cf |  | fi ui | |
118-126 | 122 | 4 | 4 + 0 = 4
| -3 | -12 | |
126-134 | 130 | 5 | 4 + 5 = 9
| -2 | -10 | |
134-142 | 138 | 10 | 9 + 10 = 19
| -1 | -10 | |
142-150 | 146 | 12 | 19 + 12 = 31
| 0 | 0 | |
150-158 | 154 | 4 | 31 + 4 = 35
| 1 | 4 | |
158-166 | 162 | 5 | 35 + 5 = 40
| 2 | 10 | |
Total |
| ∑ fi = 40 |
|
| ∑ fi ui =-18 | |
∴ Mean 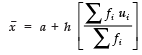
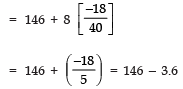
= 142.4 mm
Median: Since 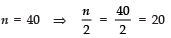 [Median class is 142-150]
l = 142
cf = 19
f = 12 and h = 8

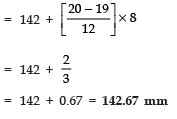
Q8. The table below shows the daily expenditure on food of 30 households in a locality:
Daily expenditure (in Rs) | Numbers of households |
100-150 | 6 |
150-200 | 7 |
200-250 | 12 |
250-300 | 3 |
300-350 | 2 |
Find the mean and median daily expenditure on food.
Sol. For finding the mean
Let the assumed mean a = 225.
h = 50
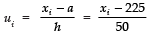
We have the following table:
| Daily expenditure | xi | fi | c.f. |  | fi ui |
100-150 | 125 | 6 | 6 + 0 = 6 | -2 | (-2) x 6 = -12 |
150-200 | 175 | 7 | 6 + 7 = 13 | -1 | (-1) x 7 = -7 |
200-250 | 225 | 12 | 13 + 12 = 25 | 0 | (0) x 12 = 0 |
250-300 | 275 | 3 | 25 + 3 = 28 | 1 | (1) x 3 = 3 |
300-350 | 325 | 2 | 28 + 2 = 30 | 2 | (2) x 2 = 4 |
Total |
| ∑ fi = 30 |
|
| ∑ fiui =-12 |
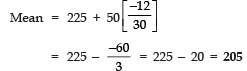
∴ Mean 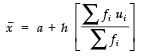
⇒ 
To find median:

And 15 lies in the class 200−250.
∴ Median class is 200−250.
∴ l = 200
cf = 13
f = 12 and h = 50
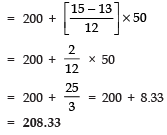
Thus, 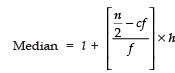
|
127 videos|551 docs|75 tests
|

FAQs on Class 10 Maths Chapter 13 Question Answers - Statistics
| 1. What is statistics and why is it important? |  |
| 2. What are the different types of data in statistics? | |
| 3. How is mean, median, and mode used in statistics? | |
| 4. What is the difference between probability and statistics? | |
| 5. How can statistics be misused or misrepresented? | |




Exam
,Class 10 Maths Chapter 13 Question Answers - Statistics
,Viva Questions
,Important questions
,Extra Questions
,Previous Year Questions with Solutions
,Free
,Class 10 Maths Chapter 13 Question Answers - Statistics
,Objective type Questions
,Class 10 Maths Chapter 13 Question Answers - Statistics
,ppt
,past year papers
,practice quizzes
,study material
,MCQs
,Sample Paper
,Semester Notes
,mock tests for examination
,shortcuts and tricks
,video lectures
,Summary
;




Long Answer Questions: Statistics - 1 Free PDF Download
Importance of Long Answer Questions: Statistics - 1
Long Answer Questions: Statistics - 1 Notes
Long Answer Questions: Statistics - 1 Class 10
Study Long Answer Questions: Statistics - 1 on the App
|
© EduRev
|
Education Revolution
|


|