Statistics Class 11 Economics
| Table of contents |
|
| Central Tendency |
|
| Arithmetic Mean |
|
| Median |
|
| Quartiles |
|
| Percentiles |
|
| Mode |
|

Central Tendency
A measure of central tendency denotes a value that represents a statistical series, typically a single or representative value. This value is chosen as it is the one to which the majority of observations are closest.
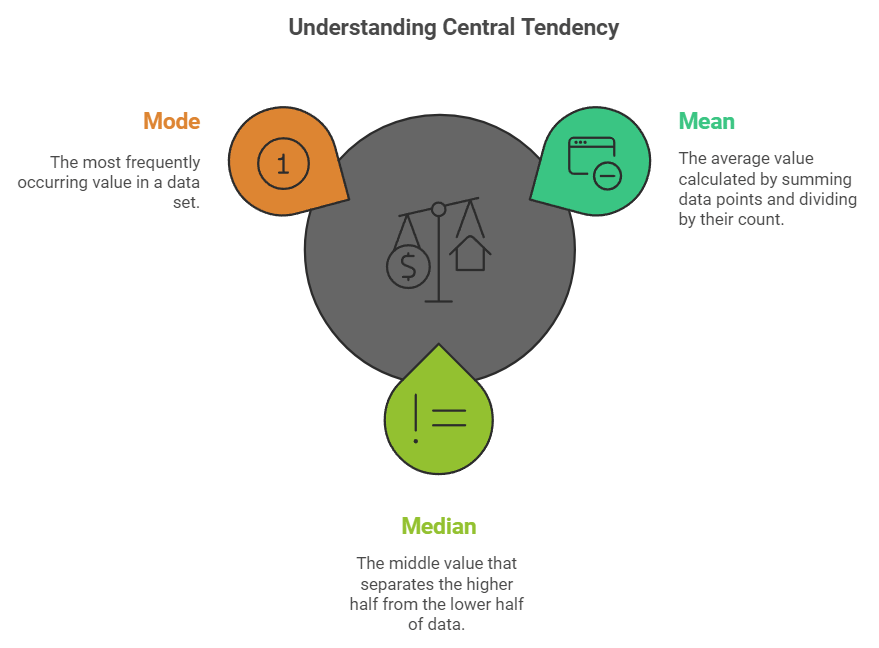
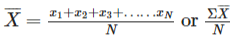
Arithmetic Mean
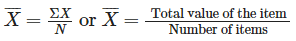
The Arithmetic Mean, denoted by X, is calculated by adding up all the values in a series and dividing the sum by the total number of items in the series. This calculation can be represented by the following formula.
Objectives of Average
- To present a brief picture of data: The use of an average allows for a concise representation of data, making it simpler to comprehend and recall.
- To make comparisons easier: Averages are useful for facilitating comparisons between data sets, as they condense the information into a single value.
- To help in decision-making: The majority of research and planning decisions are founded on the average value of specific variables.
- To help in the formulation of policies: Averages play a significant role in policy formulation, such as the consideration of per capita income by the Indian government in its efforts to alleviate poverty.
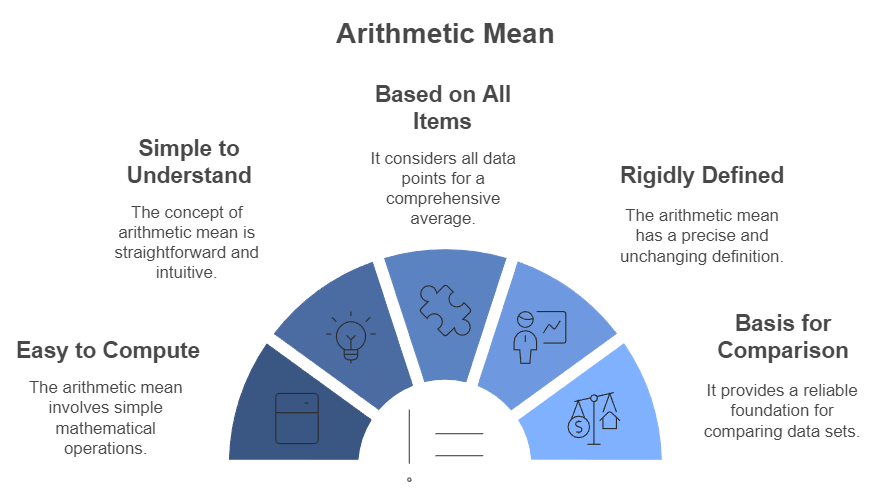
Merits and Demerits of Arithmetic Mean
(i) The following are some of the merits of using arithmetic mean:
- Easy to compute: Its calculation is straightforward, requiring only basic mathematical operations such as addition, multiplication, and division.
- Simple to understand: The concept of arithmetic mean is easy to grasp, as it represents the value per unit or cost per unit.
- Based on all items: It takes into account all values within the data set, providing a more comprehensive representation of the distribution.
- Rigidly defined: The value of arithmetic mean is always definite, as it is rigidly defined.
- A good basis for comparison: Arithmetic mean serves as a reliable basis for comparing two or more groups of data.
- Algebraic treatment: It is capable of undergoing further algebraic manipulation, making it a commonly used tool in advanced statistical analyses.
(ii) The following are some of the demerits of arithmetic mean:
- Complete data is required: The arithmetic mean requires the availability of all items in a series for computation.
- Affected by extreme values: Extreme values can have a significant impact on the calculation of the arithmetic mean, as it is based on all items in the series.
- Absurd results: There may be instances where the arithmetic mean yields illogical or absurd results, such as when the mean of the number of students in a class is reported as a decimal value.
- Calculation of mean by observation is not possible: Unlike median or mode, the arithmetic mean cannot be determined through simple observation of the series.
- No graphic representation: The arithmetic mean cannot be visually represented on a graph.
- Not possible in the case of an open-ended frequency distribution: It is not feasible to calculate the arithmetic mean for an open-ended frequency distribution without making an assumption regarding the class size.
- Not possible in the case of qualitative characteristics: The computation of arithmetic mean is not applicable to qualitative data, such as information related to intelligence, honesty, smoking habits, etc.
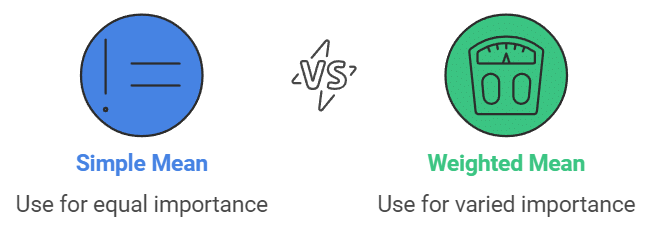
Types of Arithmetic Mean
- Simple arithmetic mean
- Weighted arithmetic mean
Methods of Calculating Simple Arithmetic Mean
(i) Individual Series: For individual series, the Arithmetic Mean can be computed using two methods:
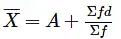
- Direct Method: This approach entails calculating the Arithmetic Mean using the formula:
- Short-cut Method: An alternative method involves using the following formula:
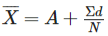
In this formula, represents the Arithmetic Mean, "A" represents the assumed average of "Ed," which is the net sum of the deviations of the various values from the assumed average, and "N" refers to the number of items in the series.
(ii) Discrete Series: There are three methods of calculating the mean of the discrete series
- Direct Method: The direct method of estimating the mean of the discrete frequency series uses the formula

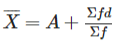
- Short-cut Method: Short cut method of estimating the mean of the discrete frequency series uses the following formula
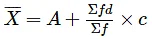
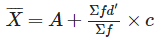
- Step-deviation Method: This method is a variant of the short-cut method. It is adopted when deviations from the assumed mean have some common factor
(iii) Frequency Distribution: There are three methods of calculating the mean in frequency distribution
- Direct Method: The direct method of estimating the mean of the discrete frequency series uses the formula

m = mid-value, mid-value =
L1 = lower limit of the class
L2 = upper limit of the class - Short-cut Method: Short cut method of estimating the mean of the frequency distribution uses the formula
- Step Deviation Method: According to this method, we find the Arithmetic Mean by the following formula
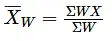
- Weighted Arithmetic Mean: It is the mean of weighted items of the series. Different items are accorded different weights depending on their relative importance. The weighted sum of the items is divided by the sum of the weights.
Calculation of Weighted Mean
According to this way, we find a weighted mean from the following information
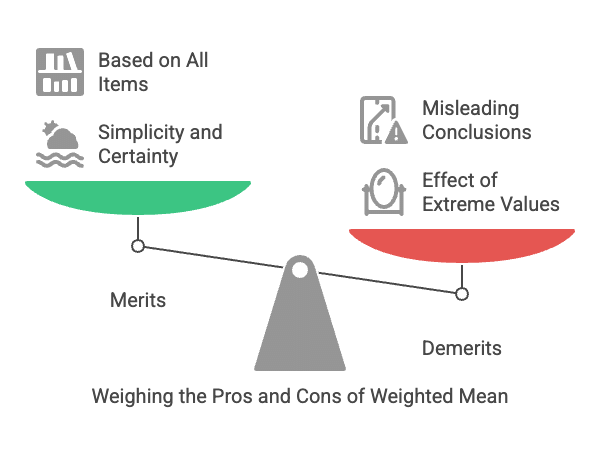
(i) Merits
- Simplicity
- Certainty
- Based on all items
- Algebraic treatment
- Stability
- Basis of comparison
- Accuracy test
(ii) Demerits
- Effect of extreme value
- The mean value may not figure in the series at all
- Laughable conclusions
- Unsuitability
- Misleading conclusions
Median
The Median is defined as the value of the variable that separates the group into two equal parts. Specifically, one part encompasses all values greater than the Median, while the other part consists of all values smaller than the Median.
Calculation of Median
- Individual Series: Calculation of Median in individual series involves the following formula M = Size of item

When N of the series is an even number, Median is estimated using the following formula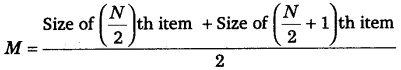
- Discrete Series: Calculation of Median in case of discrete series or frequency array involves the following formula
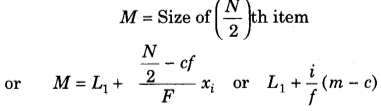
M = Size of item
item - Frequency Distribution Series: The following formula is applied to determine the Median Value
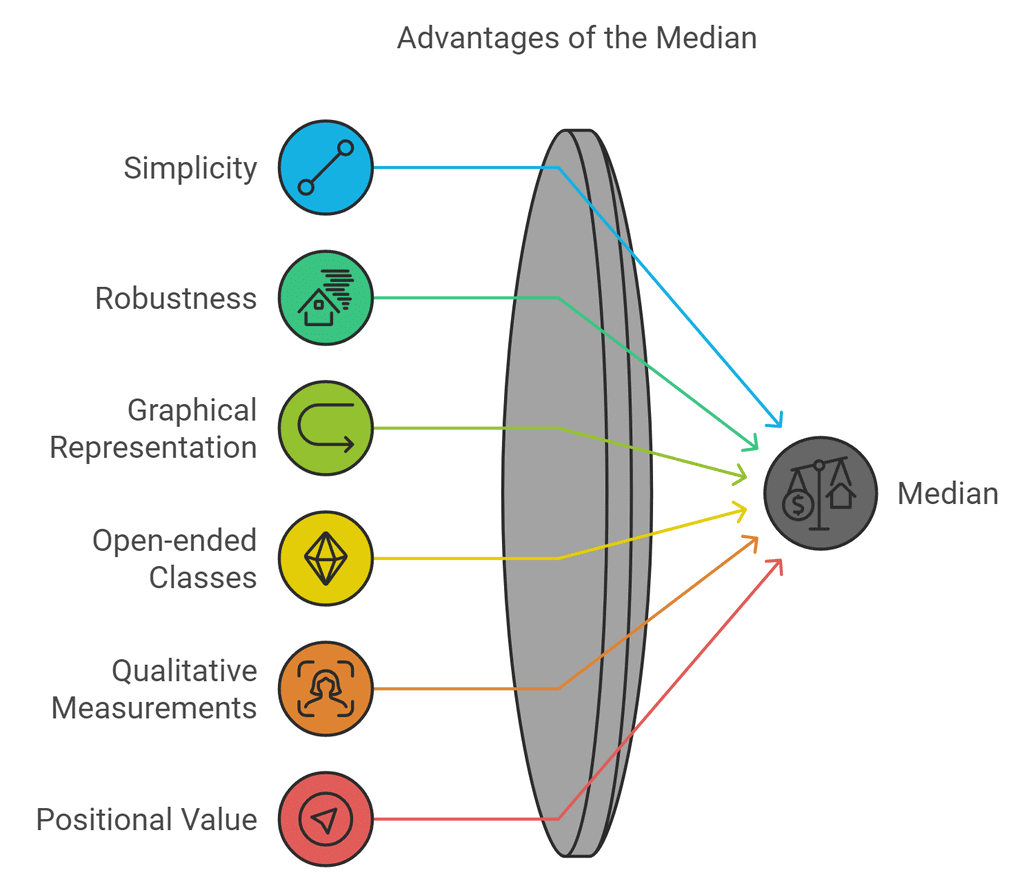
Merits of median
- The Median is simple to comprehend and calculate.
- It is less likely to be influenced by extreme observations.
- The Median can be determined graphically using ogives.
- In the case of open-ended classes, the Median is the most suitable average.
- For qualitative measurements such as intelligence or beauty, the Median is the most appropriate average.
- The Median is a positional value, not a computed value.
Demerits of Median
- As a positional average, the Median does not rely on all observations in the series.
- Arranging the data is necessary to determine the Median, unlike other averages.
- The Median cannot be precisely calculated if the series has an even number of items.
Quartiles
A quartile is defined as one of the three points that divide a statistical series into four equal parts, with each part representing a quarter of the whole data set.
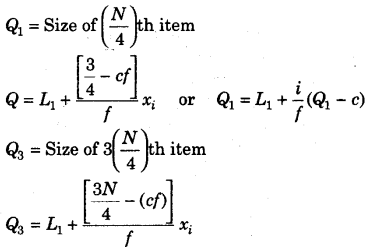
Calculation of Quartiles Quartile values (Q1 and Q3) are estimated differently for different sets of series,
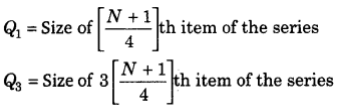
(i) Individual and Discrete Series
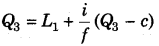
(ii) Frequency Distribution Series In frequency distribution series, the class interval of Q1 and Q3 are first identified as under
or
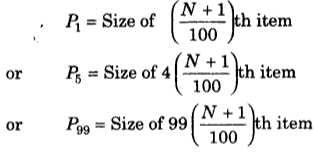
Percentiles
Percentiles divide the series into 100 equal parts and are generally expressed as P.
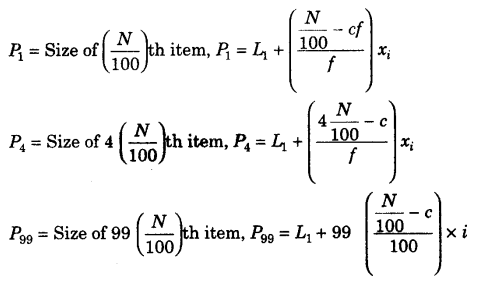
Percentiles are estimated for different types of series under
(i) Individual and Discrete Series
(ii) Frequency Distribution Series
Mode
The mode of a series is the value that appears most frequently in the series, and its corresponding frequency is the highest among all values in the series.
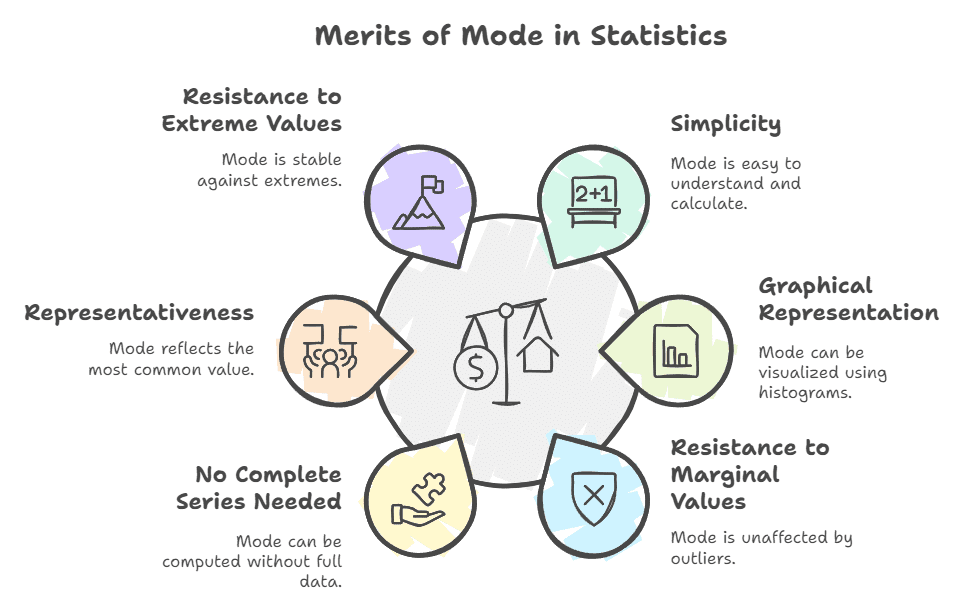
Merits of mode:
- Mode is a popular and simple measure of central tendency.
- It can be graphically located using a histogram.
- It is less affected by marginal values.
- All the items of a series are not required to be known for computing mode.
- It is the most representative value in a series.
- It is less affected by extreme values.
Demerits of mode:
- It is an uncertain measure.
- It is not capable of algebraic treatment.
- The procedure of grouping is complex.
- It is not based on all observations.
- For bi-modal and tri-modal series, it is difficult to calculate.
- Its value is not based on each and every item of the series.
|
205 videos|264 docs|136 tests
|
FAQs on Statistics Class 11 Economics
| 1. What is the difference between arithmetic mean and median in statistics? |  |
| 2. How do you calculate quartiles in a data set? | |
| 3. What are percentiles and how are they used in statistics? | |
| 4. What is the mode and how is it different from the mean and median? | |
| 5. Why is it important to understand measures of central tendency in statistics? | |


MCQs
,video lectures
,Objective type Questions
,Extra Questions
,past year papers
,Viva Questions
,shortcuts and tricks
,study material
,Previous Year Questions with Solutions
,Free
,Important questions
,Sample Paper
,Statistics Class 11 Economics
,practice quizzes
,mock tests for examination
,ppt
,Summary
,Statistics Class 11 Economics
,Statistics Class 11 Economics
,Exam
,Semester Notes
;


Chapter Notes: Measures of Central Tendency Free PDF Download
Importance of Chapter Notes: Measures of Central Tendency
Chapter Notes: Measures of Central Tendency
Chapter Notes: Measures of Central Tendency UPSC Questions
Study Chapter Notes: Measures of Central Tendency on the App
|
© EduRev
|
Education Revolution
|


|


