NCERT Solutions for Class 12 Economics - Introduction (Statistics for Economics)

Quick Recap
Statistics is a method of taking decisions on the basis of numerical data.Statistics can be defined in two ways:-
- Singular sense: Statistic Means Statistical methods and techniques related to collection, organisation, classification, Presentation, analysis and Interpretation of data.
- Plural Sense: Statistics means Numerical facts and figures Which have been systematically collected for a definite purpose in any field of study.
(i) Statistics can only deal with Quantitative data.
(ii) Statistics solve economic problems.
(iii) Statistics is of no use to Economics without Data.
Ans: (i) Statistics can only deal with quantitative data. False
Statistics deals with both quantitative and qualitative data. It not only reveals quantitative information but also reflects qualitative aspects, such as better, worse off, or highly skilled. Although qualitative aspects can be challenging to measure or express in quantitative terms, statistics describes the attributes of these variables.
(ii) Statistics solves economic problem. True
Statistics serves as a tool for economists, enabling them to understand and evaluate economic issues. The causes of a problem are identified through statistical tools and methods, which help formulate policies and rectification measures accordingly.
(iii) Statistics is of no use to economics without data. True
Data allows economists to present economic facts in a precise and concise manner. Data is inherently self-explanatory. For example, if the per capita monthly income in India increased from Rs. 300 to Rs. 600 between 1974 and 1984, an economist can analyse not only the quantitative increase in per capita income but also assess associated qualitative aspects, such as a higher standard of living, reduced poverty levels, and increased savings.
Q2: Make a list of activities that constitute the ordinary business of life. Are these economic activities?
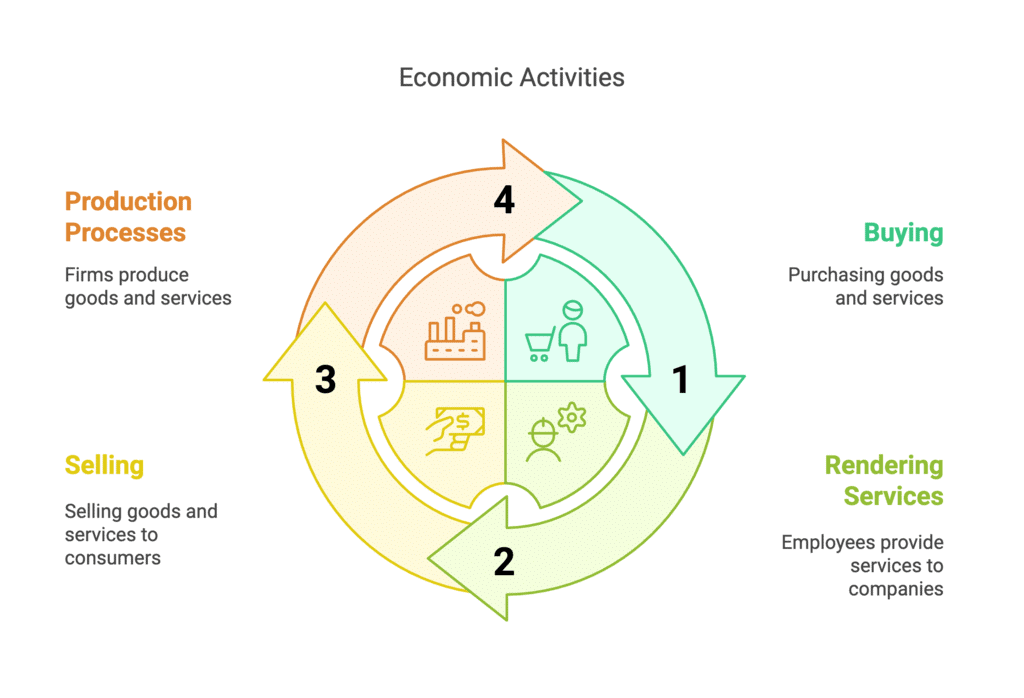
Ans: The following are the activities that constitute the ordinary business of life:
- Buying goods and services.
- Rendering services to a company by employees and workers.
- Selling goods and services.
- Production processes carried out by a firm.
Yes, the above-mentioned activities are regarded as economic activities. This is because these activities involve the use of scarce resources to carry out production, consumption, saving, and investment. They also involve the exchange of money to earn a livelihood.
Q3: ‘The Government and policy makers use statistical data to formulate suitable policies of economic development’. Illustrate with two examples.
Ans: The statistical data is of prime importance for the government and policy makers. It not only helps them to analyse and evaluate the outcomes of past policies but also assists them in taking corrective measures and formulating new policies accordingly. Furthermore, statistical data helps the government ascertain various needs and priorities to pursue the common goal of economic development. For example, if the Indian Government aims to encourage production levels, it formulates its economic policy based on the average production levels of the past three years. Another example is the preparation of the government budget, where previous data on government expenditures and revenues are considered to estimate the allocation of funds among various projects.
Q4: "You have unlimited wants and limited resources to satisfy them." Explain by giving two examples.
Ans: Every economy faces the problem of scarcity. ‘Scarcity of resources’ means that there are unlimited wants but limited resources to fulfil them. The primary concern of an economy is to allocate these scarce resources to the best possible use, given the presence of unlimited wants. Hence, the issue of scarcity forces an economy to make choices among various alternatives. For instance, an economy endowed with a specific level of resources must choose between producing guns or bread. The decision on whether to produce guns or bread—and in what quantities—depends on the needs and goals of the economy. While producing more bread may enhance the population's food security, focusing on guns could compromise food availability. The same problem of scarcity is evident at an individual level. For example, with a limited budget of Rs. 20,000, one cannot purchase both a TV and a sofa set simultaneously. Thus, the individual must choose between these alternatives according to their priorities.
Q5: How will you choose the wants to be satisfied?
Ans: An individual satisfies their wants based on their needs, the satisfaction derived from those wants, and the priorities assigned to them. Wants that provide the highest satisfaction and are given top priority will be fulfilled first. Furthermore, the choice of wants also depends on the urgency of needs, the availability of goods, and the means (such as money) to fulfil a particular want. Therefore, an individual with a sufficient budget will typically choose to fulfil a need that offers the greatest possible satisfaction.
Q6: What are your reasons for studying Economics?
Ans:
The need to study economics arises from the fundamental problem of scarcity and choice. Economics primarily focuses on allocating scarce resources to their best possible use in the face of unlimited wants. Due to the limited availability of resources, an economy must make choices that allocate these resources to areas that yield the maximum possible and optimal returns. Thus, the study of economics is crucial. The following are key reasons that make the study of economics essential:
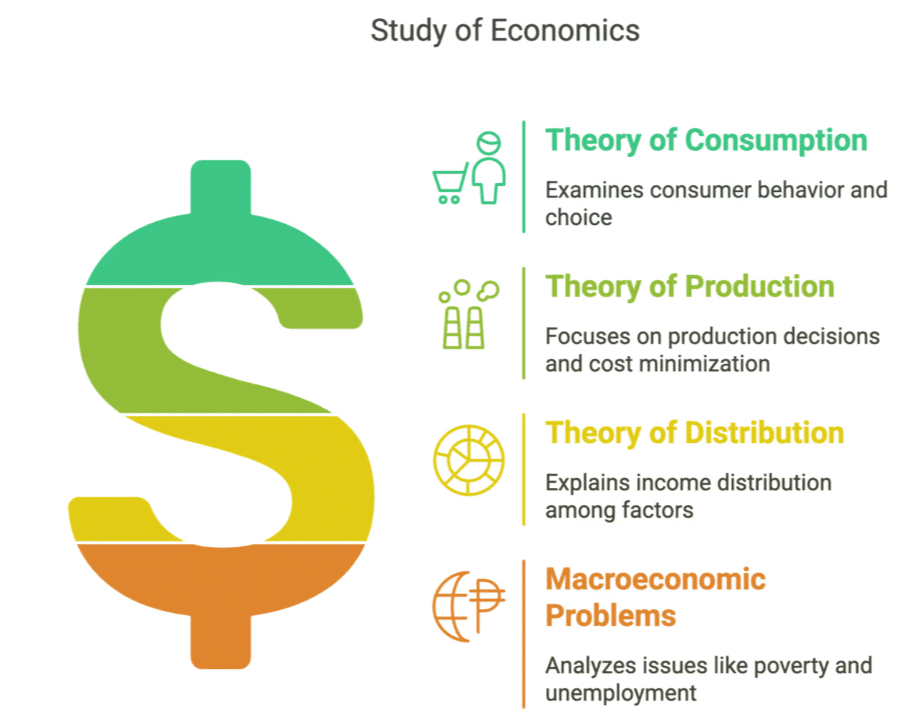
- Theory of Consumption: This theory examines consumer behaviour in various markets. It focuses on how a rational consumer makes choices to achieve maximum satisfaction given a fixed level of income and the prices of goods.
- Theory of Production: This theory investigates the production decisions of producers across different market types. It highlights how producers combine various inputs (considering their prices) to minimise production costs and maximise profits.
- Theory of Distribution: The study of economics increases our understanding of the distribution of national income. It explains how the income generated from total production is distributed among different factor owners (such as labour, entrepreneurs, land, and capital) in the form of wages, profits, rents, and interest.
- Macroeconomic Problems: Economics serves as a powerful tool for understanding and analysing fundamental macroeconomic issues faced by an economy, such as poverty, unemployment, and income disparity. It helps elucidate the interrelationships among these problems (for instance, the relationship between poverty and unemployment) and aids in developing various corrective measures.
In summary, the study of economics provides essential insights into how resources are managed and distributed within society, enabling us to address key economic challenges effectively.
Q7: Statistical methods are no substitute for common sense. Comment.
Ans: The statement draws attention to the importance of critical thinking in the field of statistics. It is essential to remember that statistical data should not be accepted blindly, as it can be easily misinterpreted or misused. Factors such as political influence, personal biases, and data manipulation can compromise the integrity of statistical findings. Additionally, statistical methods often fail to account for errors made by investigators during the process of surveying and data collection. Therefore, students must employ their common sense when analysing statistical information. This concept can be illustrated with the following example: A survey on the death rate revealed that regions with better access to doctors had a higher number of deaths per 1,000 people compared to remote areas. Such statistical data can seem counterintuitive and misleading, highlighting the necessity of applying common sense. In conclusion, students should avoid developing biased beliefs based solely on statistical data and methods. Instead, they should critically evaluate statistical results and challenge them if they contradict reasonable expectations. Statistics can be likened to clay that can be moulded to support either accurate or inaccurate conclusions. Consequently, numerical data should not be used without careful consideration and application of common sense.
Frequently Asked Questions
Q1: What are the tools used, related to statistical study?
Ans: The tools used in statistical studies include:
- Census or sampling techniques
- Tally bars for data assembly
- Graphs, tables, and diagrams
- Averages and percentages
- Regression coefficients and correlation
- Degree of relation between variables
These tools are essential for analysing data effectively and drawing meaningful conclusions.
Q2: What is inferential statistics?
Ans: Inferential statistics refers to the methods used to draw conclusions about a larger population based on a sample of data. This branch of statistics enables researchers to make predictions or generalisations beyond the immediate data available.
Q3: What is descriptive statistics?
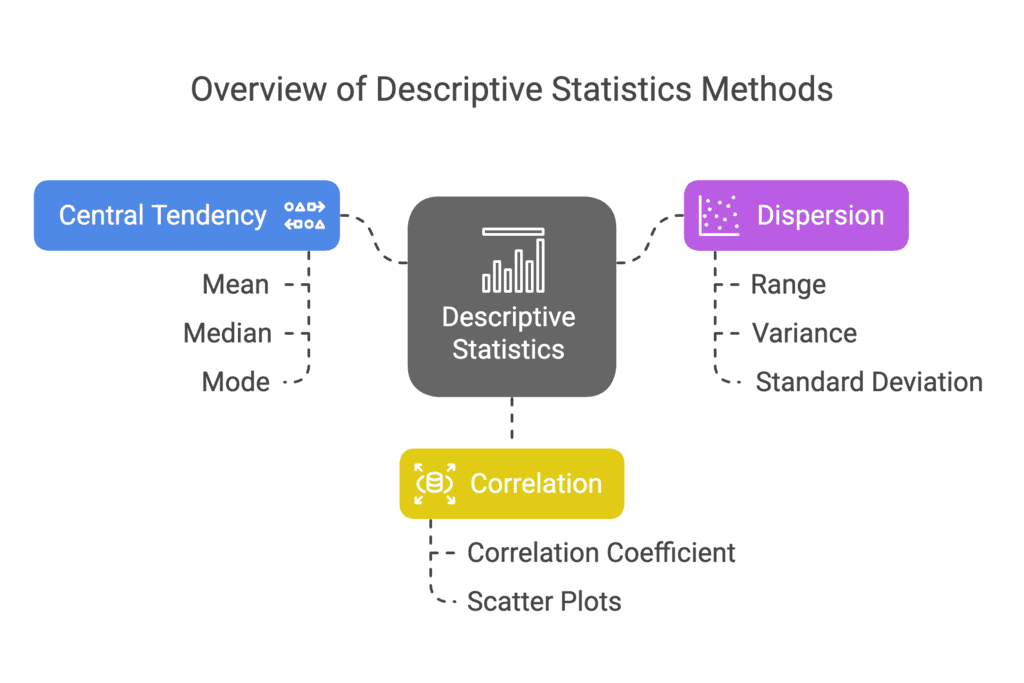
Ans: Descriptive statistics refers to methods used for the collection, presentation, and analysis of data. These methods include various estimations, such as:
- Measurement of central tendency (mean, median, mode)
- Measurement of dispersion (range, variance, standard deviation)
- Measurement of correlation (relation between variables)
Overall, descriptive statistics provide a summary of the data set, helping to convey the main features effectively.
|
58 videos|222 docs|43 tests
|
FAQs on NCERT Solutions for Class 12 Economics - Introduction (Statistics for Economics)
| 1. What is the importance of statistics in economics? |  |
| 2. How can statistics help in understanding economic concepts? | |
| 3. What are the different types of statistics used in economics? | |
| 4. How are statistics used in economic research and analysis? | |
| 5. Can statistics be used to predict future economic trends? | |


study material
,shortcuts and tricks
,Semester Notes
,mock tests for examination
,NCERT Solutions for Class 12 Economics - Introduction (Statistics for Economics)
,past year papers
,Viva Questions
,Objective type Questions
,ppt
,Previous Year Questions with Solutions
,MCQs
,video lectures
,Extra Questions
,Sample Paper
,NCERT Solutions for Class 12 Economics - Introduction (Statistics for Economics)
,NCERT Solutions for Class 12 Economics - Introduction (Statistics for Economics)
,practice quizzes
,Summary
,Exam
,Free
,Important questions
;


NCERT Solutions - Introduction (Statistics for Economics) Free PDF Download
Importance of NCERT Solutions - Introduction (Statistics for Economics)
NCERT Solutions - Introduction (Statistics for Economics) Notes
NCERT Solutions - Introduction (Statistics for Economics) Commerce Questions
Study NCERT Solutions - Introduction (Statistics for Economics) on the App
|
© EduRev
|
Education Revolution
|


|


within 7 days!