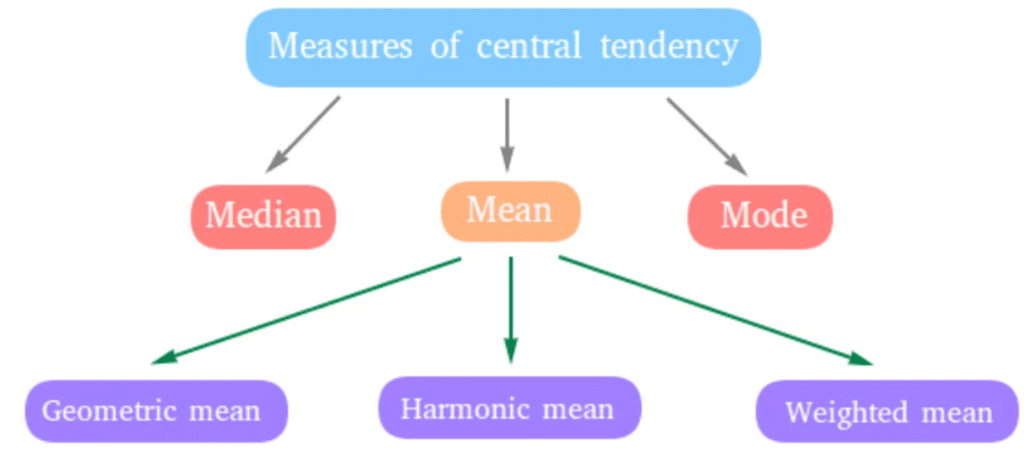
NCERT Solutions for Class 12 Economics - Measures of Central Tendency

Q1: Which average would be suitable in the following cases?
(i) Average size of readymade garments.
(ii) Average intelligence of students in a class.
(iii) Average production in a factory per shift.
(iv) Average wage in an industrial concern.
(v) When the sum of absolute deviations from average is least.
(vi) When quantities of the variable are in ratios.
(vii) In case of open-ended frequency distribution.
Ans:
(i) The average size of readymade garments is best represented by the mode, as it indicates the size that is most frequently demanded.
(ii) For the average intelligence of students in a class, the median is the most suitable measure. It divides the students into two equal groups, making it easy to estimate those above and below-average intelligence.
(iii) The average production in a factory per shift should be calculated using the mean. This arithmetic mean provides a comprehensive average of production levels.
(iv) The most appropriate measure for average wages in an industrial concern is also the mean. It is calculated by dividing the total wages by the number of workers.
(v) When the sum of absolute deviations from the average is least, the mean should be used. This is a key property of the arithmetic mean, where the total deviations equal zero.
(vi) If the quantities of the variable are in ratios, the median is preferred. It is less influenced by extreme values, providing a more stable measure.
(vii) In the case of an open-ended frequency distribution, the median is the most suitable measure, as it can be easily computed even with incomplete data.
Q2: Indicate the most appropriate alternative from the multiple choices provided against each question.
(i) The most suitable average for qualitative measurement is
(a) arithmetic mean
(b) median
(c) mode
(d) geometric mean
(e) none of the above
Ans: The median is the most suitable average for qualitative measurement. This is because the median divides a series into two equal parts, making it effective for understanding data that is not numerical.
(ii) Which average is affected most by the presence of extreme items?
(a) median
(b) mode
(c) arithmetic mean
(d) geometric mean
(e) harmonic mean
Ans: The arithmetic mean is the most affected by the presence of extreme items. It is one of the prime demerits of the arithmetic mean. It is easily distorted by the extreme values, and also the value of arithmetic mean may not figure out at all in the series.
(iii) The algebraic sum of deviation of a set of n values from A.M. is
(a) n
(b) 0
(c) 1
(d) none of the above
Ans: The algebraic sum of deviation of a set of n values from A.M. is zero. This is one of the mathematical properties of the arithmetic mean.
 Q3: Comment whether the following statements are true or false.
(i) The sum of deviation of items from median is zero.
(ii) An average alone is not enough to compare series.
(iii) Arithmetic mean is a positional value.
(iv) Upper quartile is the lowest value of top 25% of items.
(v) Median is unduly affected by extreme observations.
Ans: (i) The sum of the deviation of items from the median is zero. False
The statement is false. This mathematical property applies to the arithmetic mean that states that the sum of the deviation of all items from the mean is zero.
(ii) An average alone is not enough to compare series. True
An average indicates only the behaviour of a particular series. Therefore, in order to measure the extent of divergence of different items from the central tendency is measured by dispersion. So, the average is not enough to compare the series.
(iii) Arithmetic mean is a positional value. False
This statement is false as mean is not a positional average, rather the statement holds true for median and mode. The calculation of median and modal values is based on the position of the items in the series, i.e. why these are also termed as positional averages.
(iv) The upper quartile is the lowest value of the top 25% of items. True
The value that divides a statistical series into four equal parts, the end value of each part is called the quartile. The third quartile or the upper quartile has 75 % of the items below it and 25 % of the items above it,
(v) Median is unduly affected by extreme observations. False
This statement is true for the Arithmetic mean. The arithmetic mean is most affected by the presence of extreme items. It is one of the prime demerits of the arithmetic mean. It is easily distorted by the extreme values, and also the value of the arithmetic mean may not figure out at all in the series.
Q4: If the arithmetic mean of the data given below is 28, find (a) the missing frequency, and (b) the median of the series: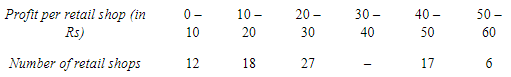 Ans:
Ans:
(i) Let the missing frequency be f1
Arithmetic Mean = 28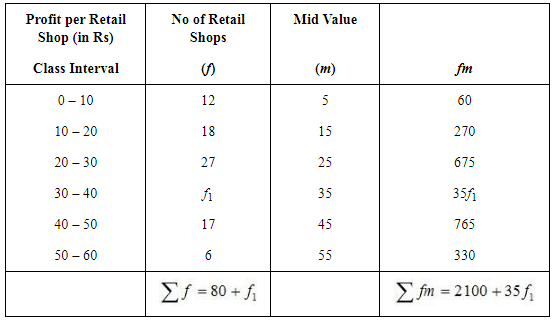
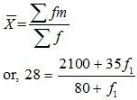
or, 2240 + 28f1 = 2100 + 35f1
or, 2240 – 2100 = 35f1 – 28f1
or, 140 = 7f1
f1 = 20
(ii)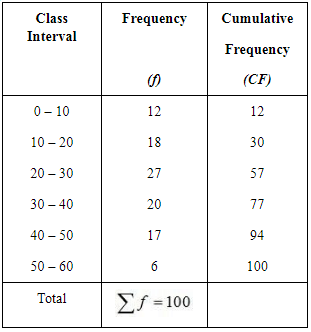
So, the Median class = Size of  item
item
= 50th item
50th item lies in the 57th cumulative frequency and the corresponding class interval is 20 – 30.
Q5: The following table gives the daily income of ten workers in a factory. Find the arithmetic mean.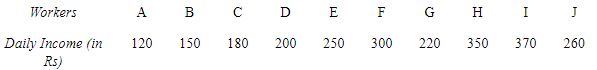 Ans:
Ans: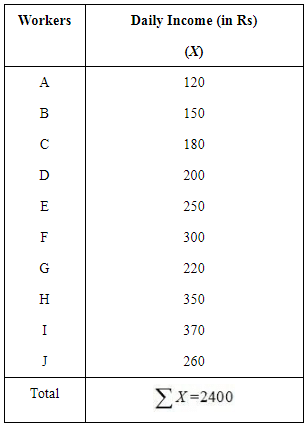 N = 10
Arithmetic mean = Rs 240
Q6: Following information pertains to the daily income of 150 families. Calculate the arithmetic mean.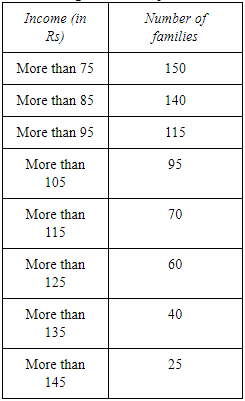 Ans:
Ans: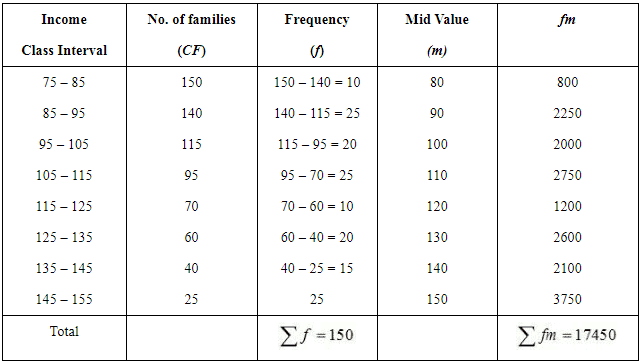
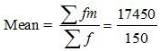
= Rs 116.33
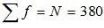
Q7: The size of land holdings of 380 families in a village is given below. Find the median size of land holdings.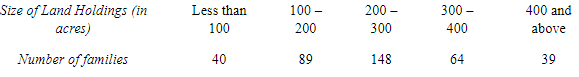 Ans:
Ans: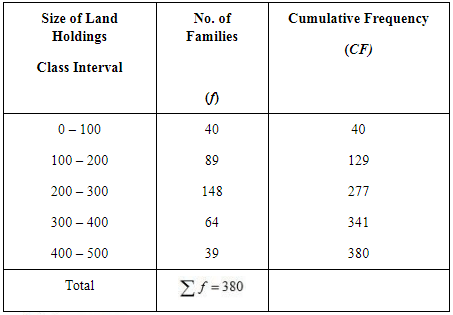
So, the Median class = Size of  item = 190th item
190th item lies in the 129th cumulative frequency and the corresponding class interval is 200 – 300.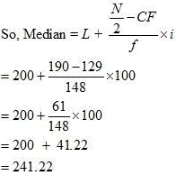
Median size of land holdings = 241.22 acres
Q8: The following series relates to the daily income of workers employed in a firm. Compute (a) highest income of lowest 50% workers (b) minimum income earned by the top 25% workers and (c) maximum income earned by lowest 25% workers.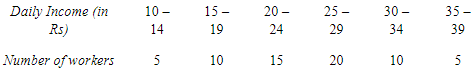 (Hint: Compute median, lower quartile and upper quartile)
Ans: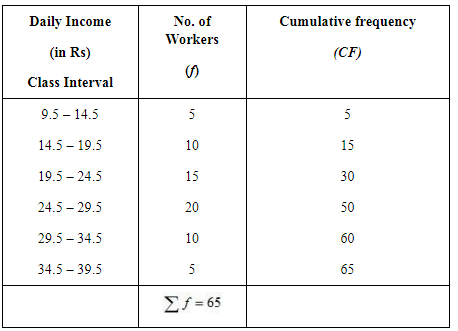 (a) Highest income of lowest 50% workers
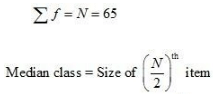
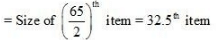
32.5th item lies in the 50th cumulative frequency and the corresponding class interval is 24.5 – 29.5.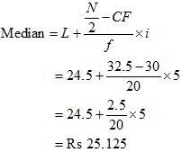
(b) Minimum income earned by top 25% workers
In order to calculate the minimum income earned by the top 25% of workers, we need to ascertain Q3.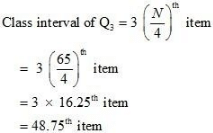
48.75th item lies in 50th item and the corresponding class interval is 24.5 – 29.5.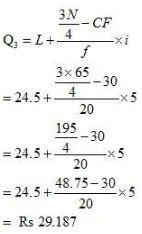
(c) Maximum income earned by lowest 25% workers
In order to calculate the maximum income earned by the lowest 25% of workers, we need to ascertain Q1.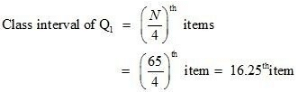
16.25th item lies in the 30th cumulative frequency and the corresponding class interval is 19.5 – 24.5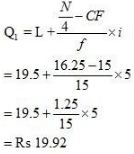
Q9: The following table gives production yield in kg. per hectare of wheat of 150 farms in a village. Calculate the mean, median and mode values.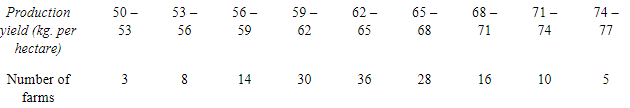 Ans: (i) Mean
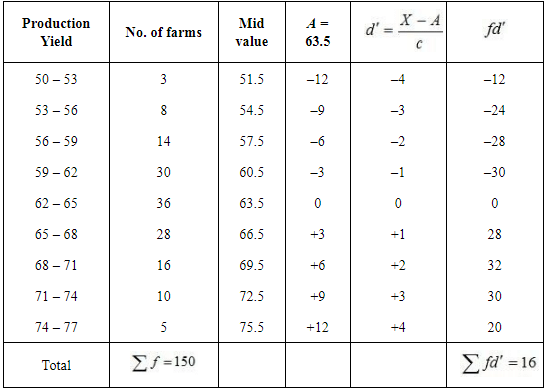
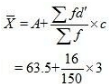
= 63.5 + 0.32
= 63.82 kg per hectare
(ii) Median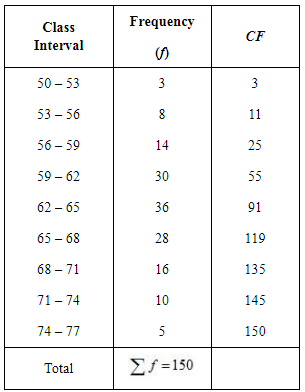
75th item lies in the 91st cumulative frequency and the corresponding class interval is 62 – 65.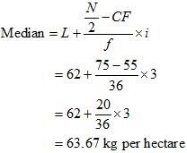
(iii) Mode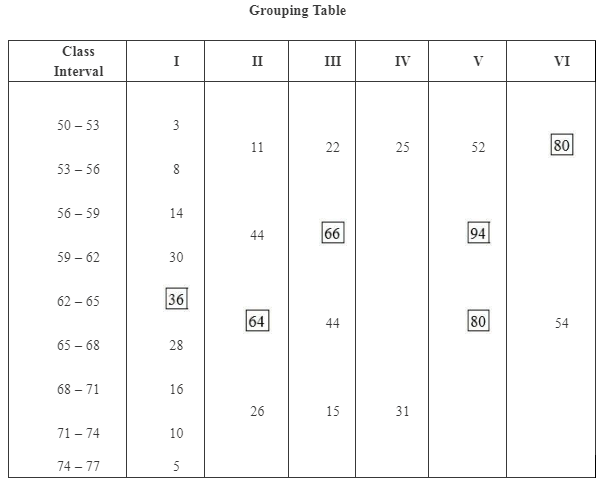
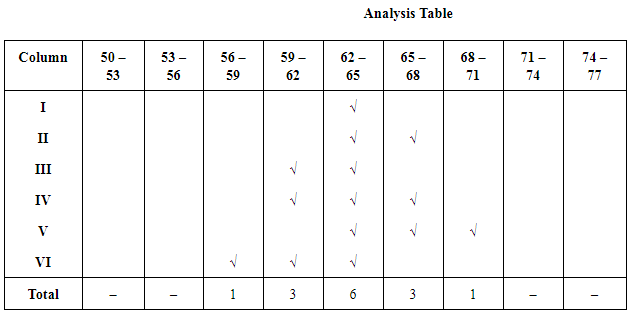 Modal class = 62 – 65
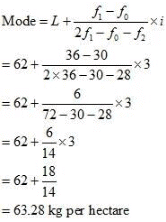
|
60 videos|287 docs|51 tests
|
FAQs on NCERT Solutions for Class 12 Economics - Measures of Central Tendency
| 1. What are measures of central tendency? |  |
| 2. How is the mean calculated? | |
| 3. When should we use the median instead of the mean? | |
| 4. What does the mode represent in a data set? | |
| 5. How do measures of central tendency help in data analysis? | |


Sample Paper
,Extra Questions
,study material
,MCQs
,mock tests for examination
,Semester Notes
,Exam
,Free
,NCERT Solutions for Class 12 Economics - Measures of Central Tendency
,Summary
,shortcuts and tricks
,past year papers
,ppt
,practice quizzes
,video lectures
,NCERT Solutions for Class 12 Economics - Measures of Central Tendency
,NCERT Solutions for Class 12 Economics - Measures of Central Tendency
,Objective type Questions
,Viva Questions
,Important questions
,Previous Year Questions with Solutions
;


NCERT Solutions - Measures of Central Tendency Free PDF Download
Importance of NCERT Solutions - Measures of Central Tendency
NCERT Solutions - Measures of Central Tendency Notes
NCERT Solutions - Measures of Central Tendency Commerce Questions
Study NCERT Solutions - Measures of Central Tendency on the App
|
© EduRev
|
Education Revolution
|


|


