Use of Newmark’s Influence Chart - Stress in Soil due to applied load, Soil Mechanics | Soil Mechanics Notes- Agricultural Engineering PDF Download
Use of Newmark’s Influence Chart
Newmark (1942) developed influence chart to determine the vertical stress due to loaded of area of any shape, irregular geometry at any point below the loaded area. A uniformly loaded circular area of radius r1 is divided into 20 divisions (say the first circle in Figure 8.1). Now if q is the intensity of loading then each small unit of the first circle will produce a vertical stress equal to \[{{{\sigma _z}}\over {20}}\] at any depth of z below the center of the loaded area (as first circle is divided into 20 small divisions). Now from Eq. 7.5 of lesson 7 one can write that at any depth z vertical stress due to each small unit of the circle as:
\[\frac{{{\sigma _Z}}}{{20}}=\frac{q}{{20}}\left[{1-{{\left( {\frac{1}{{1+{{\left( {\frac{{{r_1}}}{z}}\right)}^2}}}}\right)}^{\frac{3}{2}}}}\right]\] (8.1)
Let the right hand side of the Eq. 8.1 is equal to an arbitrary fixed value which is called influence value (say 0.005q). Thus,
\[\frac{q}{{20}}\left[{1-{{\left({\frac{1}{{1+{{\left({\frac{{{r_1}}}{z}}\right)}^2}}}}\right)}^{\frac{3}{2}}}}\right]=0.005q\] (8.2)
The influence value of the chart is equal to 0.005 and each small unit is producing a vertical stress equal to 0.005q. After solving Eq. 8.2, one can get \[{{{r_1}} \over z}=0.27\] . Thus, the radius of the first circle is 0.27z. In the influence chart (Figure 8.1), AB line representing the value of z (in the figure it is 2.5 cm). Thus, according to the chart shown in the Figure 8.1, any depth is represented by 2.5cm and based on that the scale has to be decided. According to that scale the loaded area has to be drawn for stress calculation. In the Figure 1, the radius of the first circle is 0.27 x 2.5 = 0.675 cm. Similarly, the second concentric circle of radius r2 is also divided in to 20 divisions. Including first and second circles, there are 40 divisions and again each unit is producing a vertical stress equal to 0.005q at a depth of z below the centre of the loaded area. Therefore, the each small unit in the second circle has two units and each unit will produce a vertical stress equal to 0.005q a depth of z below the centre of the loaded area. Thus, each small unit in the second circle will produce 2 x 0.005q amount of vertical stress a depth of z below the centre of the loaded area. Vertical stress due to each unit of the second circle is:
\[\frac{q}{{20}}\left[{1-{{\left({\frac{1}{{1+{{\left({\frac{{{r_2}}}{z}}\right)}^2}}}}\right)}^{\frac{3}{2}}}}\right]=2\times 0.005q\] (8.3)
Again After solving Eq. 8.3, one can get \[{{{r_2}} \over z}=0.40\] . Thus, the radius of the second circle is 0.40z. The general expression of the vertical stress produce by each unit of the each circle at a depth of z below the centre of the loaded area can be written as:
\[\frac{q}{{20}}\left[{1-{{\left({\frac{1}{{1+{{\left({\frac{{{r_i}}}{z}}\right)}^2}}}}\right)}^{\frac{3}{2}}}}\right] = i\times 0.005q\] (8.4)
where i = 1, 2, ……..9. After solving Eq. 8.4, the radius of the third to ninth circle can be determined as: 0.52z, 0.64z, 0.77z, 0.92z, 1.11z, 1.39z, 1.91z, respectively. The radius of the tenth circle is infinity and cannot be drawn.
Problem 1
A raft foundation of dimension 11m x 6.2m is placed at a depth of 2m below the ground level. Determine the net stress due to the raft foundation (stress due to applied load only) at a depth of 7m below the ground level. Also determine the total stress due to raft (stress due to applied load) and stress due to soil (overburden pressure) at a depth of 7m below the ground level. The raft is subjected to total load of 10000 kN. The unit weight of the soil is 18 kN/m3. Neglect the pore water pressure (assumed soil is completely dry).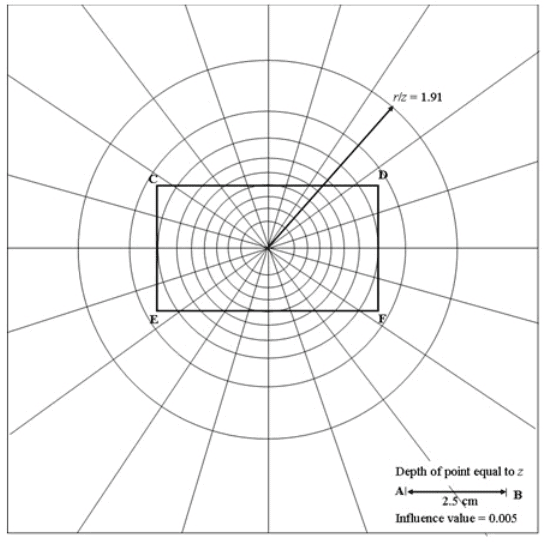
Fig. 8.1. Newmark’s influence chart to calculate vertical stress
Solution:
The total stress acting at the base of the raft = \[{{100000} \over {11 \times 6.2}}=146.6\] kN/m2. The net stress at the base of raft = 146.6 – 18 x 2 = 110.6 kN/m2 (net stress means total stress minus the stress due to the soil above the base of the foundation as before the application of load soil was existing there. Thus, stress due to soil has to be deducted to calculate the net stress).
Now, depth of the point below the base of the raft is (z) = 7 – 2 = 5m.
Thus, according to the Newmark’s chart (Figure 1), 2.5 cm = 5m. Scale is 1: 200. Now, the raft (CDEF) is drawn with a scale of 1: 200 and placed on the Newmark’s chart (as shown in Figure 8.1) such that the centre of the raft is coincided with the centre of the Newmark’s chart. This is to be noted that, here the stress below the centre of the raft is determined. Thus, centre of the raft is coincided with the centre of the Newmark’s chart. If the vertical stress below the corner or any other point within the raft is to be determined than the corner or the point on interest has to be coincided with the centre of the Newmark’s chart. The total number of influence area covered by the raft = 116 (as shown in Figure 8.1). The net stress at a depth of 7 m below the ground level or 5 m below the base of the raft = 110.6 x 0.005 x 116 = 64.2 kN/m2. Thus, vertical stress due to applied load only is 64.2 kN/m2.
The vertical stress due to the overburden pressure at a depth of 7 m below the ground level = 18 x 7 = 126 kN/m2. Thus total vertical stress due to the applied load and overburden pressure at a depth of 7 m below the ground level = (64.2 + 126) = 190.2 kN/m2.
FAQs on Use of Newmark’s Influence Chart - Stress in Soil due to applied load, Soil Mechanics - Soil Mechanics Notes- Agricultural Engineering
| 1. What is Newmark's Influence Chart? |  |
| 2. How does Newmark's Influence Chart work? | |
| 3. What is the significance of stress in soil due to an applied load? | |
| 4. Can Newmark's Influence Chart be used in agricultural engineering? | |
| 5. Are there any limitations to using Newmark's Influence Chart? | |

|
2.7K Views |

|
4.85/5 Rating |

|
Nov 23, 2024 Last updated |

|
Explore Courses for Agricultural Engineering exam
|
|
Viva Questions
,Soil Mechanics | Soil Mechanics Notes- Agricultural Engineering
,study material
,mock tests for examination
,Objective type Questions
,Exam
,Extra Questions
,practice quizzes
,Summary
,ppt
,Previous Year Questions with Solutions
,MCQs
,Soil Mechanics | Soil Mechanics Notes- Agricultural Engineering
,shortcuts and tricks
,Sample Paper
,Semester Notes
,video lectures
,Use of Newmark’s Influence Chart - Stress in Soil due to applied load
,Use of Newmark’s Influence Chart - Stress in Soil due to applied load
,Soil Mechanics | Soil Mechanics Notes- Agricultural Engineering
,past year papers
,Important questions
,Free
,Use of Newmark’s Influence Chart - Stress in Soil due to applied load
;


Use of Newmark’s Influence Chart - Stress in Soil due to applied load, Soil Mechanics Free PDF Download
Importance of Use of Newmark’s Influence Chart - Stress in Soil due to applied load, Soil Mechanics
Use of Newmark’s Influence Chart - Stress in Soil due to applied load, Soil Mechanics Notes
Use of Newmark’s Influence Chart - Stress in Soil due to applied load, Soil Mechanics Agricultural Engineering Questions
Study Use of Newmark’s Influence Chart - Stress in Soil due to applied load, Soil Mechanics on the App
|
© EduRev
|
Education Revolution
|


Follow Us
|


