Production Possibility Curve - Economics Concepts, Business Economics & Finance | Business Economics & Finance - B Com PDF Download
The production possibility curve represents graphically alternative production possibilities open to an economy.
The productive resources of the community can be used for the production of various alternative goods.
But since they are scarce, a choice has to be made between the alternative goods that can be produced. In other words, the economy has to choose which goods to produce and in what quantities. If it is decided to produce more of certain goods, the production of certain other goods has to be curtailed.
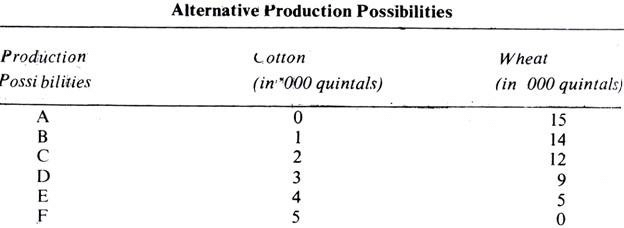
Let us suppose that the economy can produce two commodities, cotton and wheat. We suppose that the productive resources are being fully utilized and there is no change in technology. The following table gives the various production possibilities.

It all available resources are employed for the production of wheat, 15,000 quintals of it can be produced. If, on the other hand, all available resources are utilized for the production of cotton, 5000 quintals are produced. These are the two extremes represented by A and F and in between them are the situations represented by B, C, D and E. At B, the economy can produce 14,000 quintals of wheat and 1000 quintals of cotton.
At C the production possibilities are 12,000 quintals of wheat and 200u quintals of cotton, as we move from A to F, we give up some units of wheat for some units of cotton For instance, moving from A to B, we sacrifice 1000 quintals of wheat to produce 1000 quintals of cotton, and so on. As we move from A to F, we sacrifice increasing amounts of cotton.
This means that, in a full-employment economy, more and more of one good can be obtained only by reducing the production of another good. This is due to the basic fact that the economy’s resources are limited.
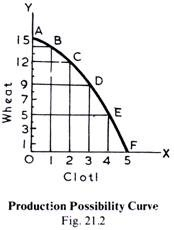
The following diagram (21.2) illustrates the production possibilities set out in the above table.

In this diagram AF is the production possibility curve, also called or the production possibility frontier, which shows the various combinations of the two goods which the economy can produce with a given amount of resources. The production possibility curve is also called transformation curve, because when we move from one position to another, we are really transforming one good into another by shifting resources from one use to another.
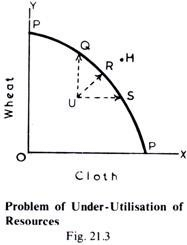
It is to be remembered that all the points representing the various reduction possibilities must lie on the production possibility curve AF and not inside or outside of it. For example, the combined output of the two goods can neither be at U nor H. (See Fig. 21.3) This is so because at U the economy will be under-employing its resources and H is beyond the resources available.

|
69 videos|101 docs|23 tests
|
FAQs on Production Possibility Curve - Economics Concepts, Business Economics & Finance - Business Economics & Finance - B Com
| 1. What is a production possibility curve? |  |
| 2. How is a production possibility curve derived? |  |
| 3. What does a point inside the production possibility curve represent? |  |
| 4. How does a production possibility curve illustrate opportunity cost? |  |
| 5. Can a production possibility curve shift outward over time? |  |


