Break Even Analysis - Production Analysis, Business Economics & Finance | Business Economics & Finance - B Com PDF Download

Break-even analysis is a technique widely used by production management and management accountants. It is based on categorising production costs between those which are "variable" (costs that change when the production output changes) and those that are "fixed" (costs not directly related to the volume of production).
Total variable and fixed costs are compared with sales revenue in order to determine thelevel of sales volume, sales value or production at which the business makes neither a profit nor a loss (the "break-even point").
The Break-Even Chart
In its simplest form, the break-even chart is a graphical representation of costs at various levels of activity shown on the same chart as the variation of income (or sales, revenue) with the same variation in activity. The point at which neither profit nor loss is made is known as the "break-even point" and is represented on the chart below by the intersection of the two lines:
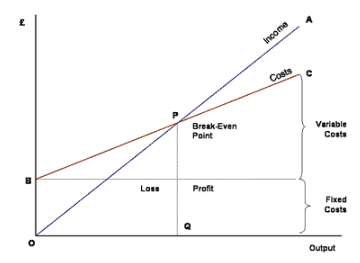
In the diagram above, the line OA represents the variation of income at varying levels of production activity ("output"). OB represents the total fixed costs in the business. As output increases, variable costs are incurred, meaning that total costs (fixed + variable) also increase. At low levels of output, Costs are greater than Income. At the point of intersection, P, costs are exactly equal to income, and hence neither profit nor loss is made.
Fixed Costs
Fixed costs are those business costs that are not directly related to the level of production or output. In other words, even if the business has a zero output or high output, the level of fixed costs will remain broadly the same. In the long term fixed costs can alter - perhaps as a result of investment in production capacity (e.g. adding a new factory unit) or through the growth in overheads required to support a larger, more complex business.
Examples of fixed costs:
- Rent and rates
- Depreciation
- Research and development
- Marketing costs (non- revenue related)
- Administration costs
Variable Costs
Variable costs are those costs which vary directly with the level of output. They represent payment output-related inputs such as raw materials, direct labour, fuel and revenue-related costs such as commission.
A distinction is often made between "Direct" variable costs and "Indirect" variable costs.
Direct variable costs are those which can be directly attributable to the production of a particular product or service and allocated to a particular cost centre. Raw materials and the wages those working on the production line are good examples.
Indirect variable costs cannot be directly attributable to production but they do vary with output. These include depreciation (where it is calculated related to output - e.g. machine hours), maintenance and certain labour costs.
Semi-Variable Costs
Whilst the distinction between fixed and variable costs is a convenient way of categorising business costs, in reality there are some costs which are fixed in nature but which increase when output reaches certain levels. These are largely related to the overall "scale" and/or complexity of the business. For example, when a business has relatively low levels of output or sales, it may not require costs associated with functions such as human resource management or a fully-resourced finance department. However, as the scale of the business grows (e.g. output, number people employed, number and complexity of transactions) then more resources are required. If production rises suddenly then some short-term increase in warehousing and/or transport may be required. In these circumstances, we say that part of the cost is variable and part fixed.
|
69 videos|121 docs|23 tests
|
FAQs on Break Even Analysis - Production Analysis, Business Economics & Finance - Business Economics & Finance - B Com
| 1. What is a break-even analysis in production analysis? |  |
| 2. How is break-even point calculated in production analysis? | |
| 3. What is the significance of break-even analysis in business economics? | |
| 4. How does break-even analysis assist in financial decision-making? | |
| 5. What are the limitations of break-even analysis in production analysis? | |


MCQs
,Break Even Analysis - Production Analysis
,Objective type Questions
,Important questions
,Semester Notes
,shortcuts and tricks
,Break Even Analysis - Production Analysis
,Viva Questions
,practice quizzes
,Business Economics & Finance | Business Economics & Finance - B Com
,mock tests for examination
,Sample Paper
,study material
,Previous Year Questions with Solutions
,Summary
,Free
,Business Economics & Finance | Business Economics & Finance - B Com
,Extra Questions
,ppt
,Business Economics & Finance | Business Economics & Finance - B Com
,Exam
,past year papers
,Break Even Analysis - Production Analysis
,video lectures
;


Break Even Analysis - Production Analysis, Business Economics & Finance Free PDF Download
Importance of Break Even Analysis - Production Analysis, Business Economics & Finance
Break Even Analysis - Production Analysis, Business Economics & Finance Notes
Break Even Analysis - Production Analysis, Business Economics & Finance B Com Questions
Study Break Even Analysis - Production Analysis, Business Economics & Finance on the App
|
© EduRev
|
Education Revolution
|


|


within 7 days!