Question: Velocity-time Graph, Motion, Class 9 PDF Download
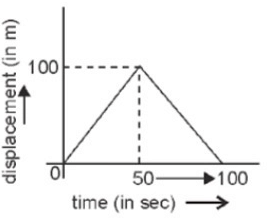
A girl walks along a straight path of about 100m in 50sec to drop a letter and comes back to her initial position. what will be the velocity-time graph?
Ref: https://edurev.in/question/479198/A-girl-walks-along-a-straight-path-of-about-100m-in-50sec-to-drop-a-letter-and-comes-back-to-her-ini

From the graph of displacement time graph, we can interpret that initial velocity is 0 as displacement and time are 0 .
Velocity after 50 seconds;
= 100/50
=2 m/s
= velocity after 100sec
=zero
Velocity with time table is given below :
V 0 2 0
t 0 50 100
Refer the attachment for the Displacement time graph and velocity time graph
FAQs on Question: Velocity-time Graph, Motion, Class 9
| 1. What is a velocity-time graph? |  |
| 2. How can we interpret a velocity-time graph? | |
| 3. How can we determine an object's average velocity from a velocity-time graph? | |
| 4. What does a horizontal line on a velocity-time graph represent? | |
| 5. How can we determine an object's acceleration from a velocity-time graph? | |


shortcuts and tricks
,Extra Questions
,Question: Velocity-time Graph
,Motion
,Summary
,Free
,Viva Questions
,Semester Notes
,Question: Velocity-time Graph
,study material
,Motion
,video lectures
,practice quizzes
,Motion
,past year papers
,ppt
,Important questions
,MCQs
,Class 9
,Class 9
,Exam
,mock tests for examination
,Objective type Questions
,Sample Paper
,Question: Velocity-time Graph
,Class 9
,Previous Year Questions with Solutions
,


Question: Velocity-time Graph, Motion, Class 9 Free PDF Download
Importance of Question: Velocity-time Graph, Motion, Class 9
Question: Velocity-time Graph, Motion, Class 9 Notes
Question: Velocity-time Graph, Motion, Class 9 Class 9 Questions
Study Question: Velocity-time Graph, Motion, Class 9 on the App
|
© EduRev
|
Education Revolution
|


|


