Class 6 Exam  >  Class 6 Notes  >  RD Sharma Solutions for Class 6 Mathematics  >  RD Sharma Solutions -Ex-22.1, Data Handling Pictographs, Class 6, Maths

Ex-22.1, Data Handling Pictographs, Class 6, Maths RD Sharma Solutions | RD Sharma Solutions for Class 6 Mathematics PDF Download

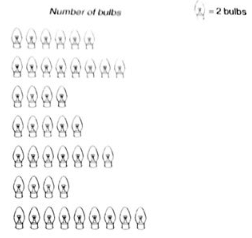
Q. 1. The sale of electric bulbs on different days of a week is shown below:

Observe the pictograph and answer the following questions:

(i) How many bulbs were sold Friday?

(ii) On which day maximum numbers of bulbs were sold?

(iii) If one bulb were sold at the rate of Rs 10, what was the total earning on Sunday?

(iv) Can you find out the total earning of the week?

(v) If one big carton can hold 9 bulbs. How many cartons were needed in the given week, more than 7, more than 8 or more than 9?

Ex-22.1, Data Handling Pictographs, Class 6, Maths RD Sharma Solutions | RD Sharma Solutions for Class 6 MathematicsEx-22.1, Data Handling Pictographs, Class 6, Maths RD Sharma Solutions | RD Sharma Solutions for Class 6 Mathematics

Sol:

(i) Number of figures of bulbs shown against Friday = 7

Given: 1 figure = 2 bulbs

Therefore, Total number of bulbs sold on Friday = 2 x 7 = 14

(ii) Sunday shows the maximum number of figure of bulbs, i.e. 9

Therefore, On Sunday, maximum bulbs were sold.

(iii) Number of figures of bulbs shown against Sunday = 9

Therefore, Total number of bulbs sold on Sunday = 2 x 9 = 18

Given, the cost of each bulb = Rs 10

Therefore, Total earning on Sunday = Rs 10 x 18 = Rs 180

(iv) Total number of figures of bulbs shown throughout the week

= 6 + 8 + 4 + 5 + 7 + 4 + 9 = 43

Therefore, Total number of bulbs = 43 x 2 = 86

Therefore, Total earning of the week = Rs 10 x 86 = Rs 860.

(v) Total number of bulbs = 86

Given that one big carton can hold 9 bulbs.

Therefore, for holding 86 bulbs, we need

869=959 cartons

So, more than 9 cartons are needed.


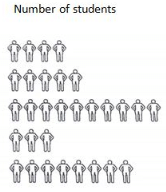
Q. 2. A survey was carried out in a certain school to find about different modes of transport used by students to travel to school each day. 30 students of class VI were interviewed and the data obtained was displayed in the form of pictographs given below:

Mode of transport Number of students

Ex-22.1, Data Handling Pictographs, Class 6, Maths RD Sharma Solutions | RD Sharma Solutions for Class 6 MathematicsEx-22.1, Data Handling Pictographs, Class 6, Maths RD Sharma Solutions | RD Sharma Solutions for Class 6 Mathematics

Look at the above pictograph and answer the following questions:

(i) Look at the above pictograph and answer the following questions

(ii) How many students are using cycle or walking as a mode of travel?

(iii) Which is the most popular mode of travel?

Sol: (i) Number of students shown traveling to school using cycle = 3

Number of students shown walking to school = 8

Therefore, Number of students using cycle or walking as a mode of travelling to school = 3 + 8 =11

(ii) The pictograph shows that the maximum number of students, i.e. 10 are using the school bus as a mode of traveling to school.

Therefore, the most popular mode of travel to school is the school bus.


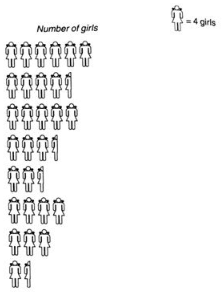
Q. 3. The number of girl students in each class of co-ed. Middle school is depicted by the following pictograph:

Ex-22.1, Data Handling Pictographs, Class 6, Maths RD Sharma Solutions | RD Sharma Solutions for Class 6 MathematicsEx-22.1, Data Handling Pictographs, Class 6, Maths RD Sharma Solutions | RD Sharma Solutions for Class 6 Mathematics

Observe the above pictograph and answer the following questions:

(i) Which class has the maximum number of girl students?

(ii) is the number of girls in class VI is less than the number of girls in class V?

(iii) How many girls are there in VII class?

Sol:

Based on the above pictograph, we can prepare the following chart to determine the number of girl students in each class.

Given, 1 figure = 4 girls

ClassNumbers of girls
I6 x 4 = 24
II4.5 x 4 = 18
III5 x 4 = 20
IV3.5 x 4 = 14
V2.5 x 4 = 10
VI4 x 4 = 16
VII3 x 4 = 12
VIII1.5 x 4 = 6

(i) From the chart we can easily say that the maximum number of girls i.e 24 are present in Class I

Therefore, Class I has the maximum number of girls.

(ii) Number of girls in class VI = 16

Number of girls in class V = 10

Therefore, number of girls in class VI is not less than the number of girls in class V

Ans: No

(iii) From the chart, we can say that these are 12 girls in class VII


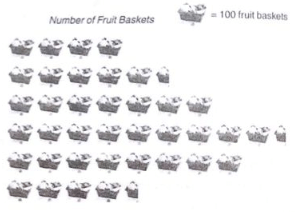
Q. 4. In a village six fruit merchants sold the following number of fruit baskets in particular season:

Ex-22.1, Data Handling Pictographs, Class 6, Maths RD Sharma Solutions | RD Sharma Solutions for Class 6 MathematicsEx-22.1, Data Handling Pictographs, Class 6, Maths RD Sharma Solutions | RD Sharma Solutions for Class 6 Mathematics

Observe the above pictograph and answer the following questions.

(i) Which merchant sold the maximum number of baskets?

(ii) How many fruit baskets were sold by Anwar?

(iii) The merchants who have sold 600 or more number of baskets are planning to buy a godown for the next season. Can you name them?

Sol:

Given, one figure = 100 fruit baskets

Based on the above pictographs and hints, we can prepare the following charts to ascertain the maximum number of fruit baskets sold by each merchant:

MerchantNumbers of fruit baskets
Rahim4 x 100 = 400
Lakhan pal5.5 x 100 = 550
Anwar7 x 100 = 700
Martin9.5 x 100 = 950
Ranjit singh8 x 100 = 800
Joseph4.5 x 100 = 450

(i) On the above chart we can see that martin sold the maximum number of baskets i.e. 950 fruits baskets.

Ans: Martin

(ii) Anwar sold 700 fruit baskets

(iii) On the above chart we can see that Anwar sold 700 fruit baskets, Martin sold 950 fruit baskets and Ranjit Singh sold 800 fruit baskets. Therefore, Anwar, Martin and Ranjit Singh are the merchants who are planning to buy a godown for the next season.


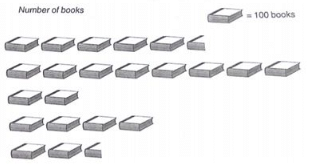
Q. 5. The pictograph shows different subject books which are kept in a library.

Ex-22.1, Data Handling Pictographs, Class 6, Maths RD Sharma Solutions | RD Sharma Solutions for Class 6 MathematicsEx-22.1, Data Handling Pictographs, Class 6, Maths RD Sharma Solutions | RD Sharma Solutions for Class 6 Mathematics

(i) How many English books are there in the library?

(ii) How many maths books are there?

(iii) Which books are maximum in number?

(iv) Which books are minimum in number?

Given, 1 figure = 100 books

Based on the above pictograph and the given data, we can prepare the following chart to ascertain the number of books present in the library for each subject:

SubjectsNumbers of books
Hindi5.5 x 100 = 550
English8 x 100 = 800
History2 x 100 = 200
Science4 x 100 = 400
Math2.5 x 100 = 250

(i) From the above charts, we can say that there are 800 English books in the library.

(ii) The calculation on the above chart shows that there are 250 Math books in the library.

(iii) From the above charts, we can say that the English books are maximum in number, as there are 800 books on that subject.

Therefore, English

(iv) From the above chart, we can see that the History books are minimum in number, as there are only 200 books of that subjects

Therefore, History

The document Ex-22.1, Data Handling Pictographs, Class 6, Maths RD Sharma Solutions | RD Sharma Solutions for Class 6 Mathematics is a part of the Class 6 Course RD Sharma Solutions for Class 6 Mathematics.
All you need of Class 6 at this link: Class 6
99 docs

Top Courses for Class 6

FAQs on Ex-22.1, Data Handling Pictographs, Class 6, Maths RD Sharma Solutions - RD Sharma Solutions for Class 6 Mathematics

1. How can I solve pictographs in data handling?
Ans. To solve pictographs in data handling, follow these steps: 1. Read the pictograph carefully and understand the symbols used. 2. Analyze the key or legend provided to understand the representation of each symbol. 3. Count the number of symbols for each category in the pictograph. 4. Use the scale mentioned in the pictograph to determine the actual quantity represented by each symbol. 5. Record the data in a table or chart for better visualization. 6. Analyze the data and draw conclusions based on the pictograph representation.
2. What are the advantages of using pictographs in data handling?
Ans. Pictographs have several advantages in data handling: 1. Visual Representation: Pictographs use symbols or pictures to represent data, making it easier to understand and interpret information visually. 2. Engaging and Interactive: Pictographs are visually appealing and can engage students or readers, making data analysis more interesting and interactive. 3. Simplifies Complex Data: Pictographs can simplify complex data by breaking it down into visual elements, making it easier to compare and analyze different categories. 4. Quick Understanding: Pictographs provide a quick overview of the data, allowing readers to grasp the main points without going through lengthy tables or charts. 5. Universal Language: Pictographs have a universal language of symbols, making it easier to communicate and understand data across different cultures and languages.
3. How can I create a pictograph for my data?
Ans. Follow these steps to create a pictograph for your data: 1. Identify the categories or groups that need to be represented in the pictograph. 2. Choose suitable symbols or pictures that can represent each category effectively. 3. Determine a scale to represent the quantity or frequency of each category. 4. Decide on the key or legend that explains the symbols used in the pictograph. 5. Draw a grid or chart to represent the categories and the scale. 6. Use the chosen symbols to fill in the grid or chart based on the data. 7. Add a title and labels to make the pictograph clear and understandable. 8. Review and revise the pictograph if necessary to ensure accuracy and clarity.
4. How can I interpret a pictograph?
Ans. To interpret a pictograph, follow these steps: 1. Understand the symbols: Look at the symbols used in the pictograph and refer to the key or legend provided to understand what each symbol represents. 2. Count the symbols: Count the number of symbols in each category to determine the frequency or quantity represented. 3. Use the scale: Refer to the scale mentioned in the pictograph to understand the actual quantity represented by each symbol. 4. Compare categories: Compare the number of symbols in different categories to identify the category with the highest or lowest frequency. 5. Draw conclusions: Analyze the data and draw conclusions based on the representation in the pictograph. Identify patterns, trends, or relationships between categories. 6. Communicate the findings: Use the pictograph to communicate the information effectively, either through a presentation, report, or discussion.
5. What precautions should I take while creating a pictograph?
Ans. While creating a pictograph, it is important to take the following precautions: 1. Choose appropriate symbols: Select symbols that are easily recognizable and accurately represent the categories or groups being depicted. 2. Maintain consistency: Use the same scale and symbols throughout the pictograph to ensure consistency and avoid confusion. 3. Avoid overcrowding: Ensure that the symbols are not overcrowded in the grid or chart, as it may make the pictograph difficult to interpret. 4. Use a clear title and labels: Provide a clear title and labels for the pictograph to make it easy to understand and interpret the data. 5. Use a suitable scale: Determine a suitable scale that accurately represents the quantity or frequency being depicted and is easy to interpret. 6. Review for accuracy: Double-check the data and the representation in the pictograph to ensure accuracy and avoid any errors or misleading information.
99 docs
Download as PDF
Explore Courses for Class 6 exam

Top Courses for Class 6

Signup for Free!
Signup to see your scores go up within 7 days! Learn & Practice with 1000+ FREE Notes, Videos & Tests.
10M+ students study on EduRev
Related Searches

pdf

,

Ex-22.1

,

Ex-22.1

,

Class 6

,

Ex-22.1

,

Data Handling Pictographs

,

Maths RD Sharma Solutions | RD Sharma Solutions for Class 6 Mathematics

,

Exam

,

mock tests for examination

,

practice quizzes

,

Sample Paper

,

Free

,

past year papers

,

MCQs

,

Data Handling Pictographs

,

shortcuts and tricks

,

Extra Questions

,

Maths RD Sharma Solutions | RD Sharma Solutions for Class 6 Mathematics

,

Data Handling Pictographs

,

Class 6

,

Important questions

,

Class 6

,

Summary

,

ppt

,

Objective type Questions

,

study material

,

Previous Year Questions with Solutions

,

Viva Questions

,

video lectures

,

Maths RD Sharma Solutions | RD Sharma Solutions for Class 6 Mathematics

,

Semester Notes

;