Speed – Time Graphs - Class 9 PDF Download
What is time graph?
Ref: https://edurev.in/question/637297/What-is-time-graph-

Speed – Time Graphs:
We know that the speed at a certain time is the magnitude of the velocity at that time. So we can follow equations of motion to draw speed time graphs.
Case 1: Speed-time graphs with constant speed (zero acceleration)
When the speed is constant, the speed time graph, with Y-axis denoting speed and X-axis denoting time, will be like:
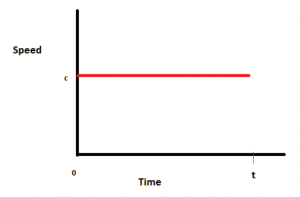
Speed-time graph for constant speed
As clear from the graph, the speed is constant (c) throughout the time interval. No matter how much the time changes, the speed will be c at every instant.
Example: If the acceleration of a particle is zero (0), and speed is constant say 5 m/s at t =0, then it will remain constant throughout the time.
Case 2: Speed-time graphs with constant acceleration
When the acceleration is constant, and the initial speed of the particle is zero, the speed of the particle will increase linearly, as predicted by the equation:
v = u + at
Since u = 0
v = at
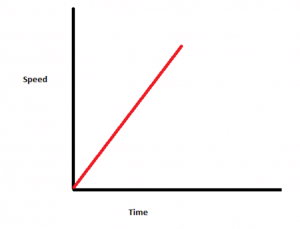
Speed-time graph with constant acceleration
As shown in the figure, the speed of the particle will increase linearly with respect to time. The slope of the graph will give the magnitude of acceleration.
Example: If the acceleration of a particle is constant (k) and initial speed is zero, the speed increases or decreases linearly. The slope of speed-time graph will give the magnitude of acceleration (k).
Case 3: Speed-time graphs with increasing acceleration
When the acceleration is increasing with time, the speed time graph will be a curve, as predicted from the equation:
v = u + at
Since u = 0
v= at
Since acceleration is a function of time, speed time graph will be a curve.
Note: Since the acceleration is continuously increasing with time, the magnitude of the slope will also continuously increase with time.
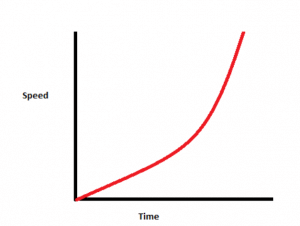
Speed-time graph with increasing acceleration
Example: If the acceleration of a particle is a function of time and initial speed is zero, the speed-time graph will be a curve. The slope of speed-time graph at any instant (at a certain time) will give the magnitude of acceleration at that time.
Case 3 was just the case of increasing acceleration. There will be a different graph when the acceleration is decreasing with time.
Stay tuned with Byju’s to learn more about speed time graphs, motion graphs and much more.

study material
,Semester Notes
,Exam
,Speed – Time Graphs - Class 9
,Sample Paper
,MCQs
,Speed – Time Graphs - Class 9
,shortcuts and tricks
,Summary
,Objective type Questions
,ppt
,practice quizzes
,mock tests for examination
,Viva Questions
,Extra Questions
,Free
,Previous Year Questions with Solutions
,Important questions
,Speed – Time Graphs - Class 9
,video lectures
,past year papers
;


Speed – Time Graphs Free PDF Download
Importance of Speed – Time Graphs
Speed – Time Graphs Notes
Speed – Time Graphs Class 9 Questions
Study Speed – Time Graphs on the App
|
© EduRev
|
Education Revolution
|


|


within 7 days!