Theory of IR Absorption - IR Spectroscopy | Organic Chemistry PDF Download

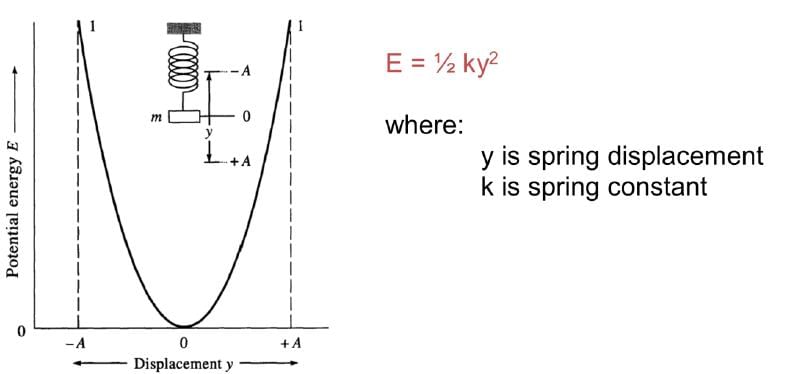
Harmonic Oscillator Model: It is approximate representation of atomic stretching. We assume two masses attached by a spring.
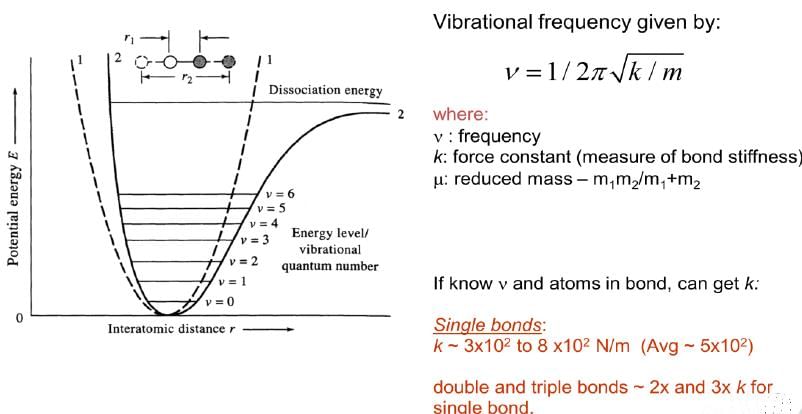
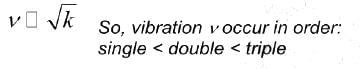
Anharmonic oscillation: Harmonic oscillation model is good at low energy levels (n0, n1, n2, …). But it is not good at high energy levels.
- As atoms approach, coulombic repulsion force adds to the bond force making energy increase greater than the ideal one.
- As atoms separate, dissociation energy arrives and the harmonic function rises quickly.
Because of Anharmonics: At low dissociation energy, Δv =±2, ±3 are observed which cause the appearance of overtone lines at frequencies 2-3 times the fundamental frequency. Normally Δv = ± 1
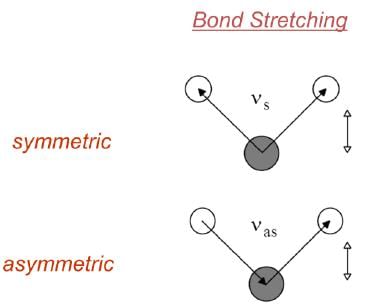
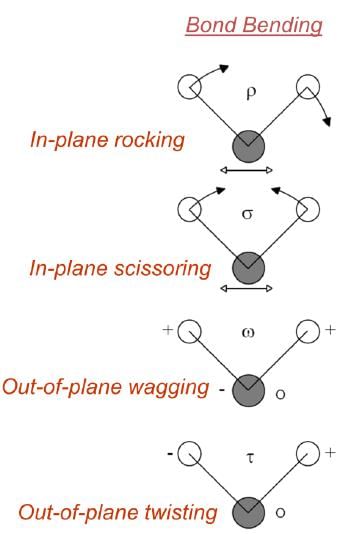
Types of Molecular Vibrations
Infrared radiation is largely thermal energy. It induces stronger molecular vibrations in covalent bonds, which can be viewed as springs holding together two masses, or atoms. Specific bonds respond to (absorb) specific frequencies
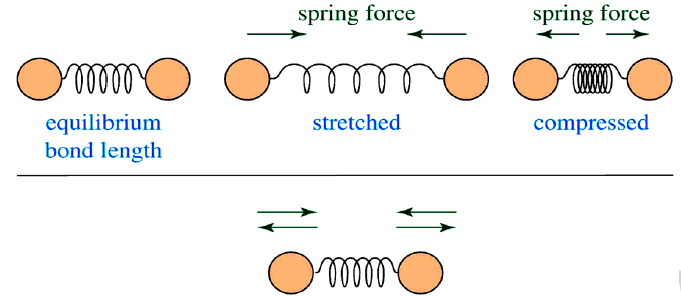
- If a bond is stretched, a restoring force pulls the two atoms towards their equilibrium position.
- If a bond is compressed, a restoring force pushes the two atoms towards their equilibrium position.
- If a bond is stretched to a certain limit, the bond reaches its dissociation energy and is broken.
VIBRATIONAL MODES
- Covalent bonds can vibrate in several modes, including stretching and bending.
- The most useful bands in an infrared spectrum correspond to stretching frequencies, and those will be the ones we’ll focus on.
Fundamental Principle: Only those vibrations that result in a rhythmical change in the dipole moment of the molecule are observed in IR. (Selection Rule)
- A change in dipole produces a fluctuating electric field, which is necessary to interact with the fluctuating electric field of the IR light.
- C=O stretching changes the dipole moment by a large amount. Hence this shows a sharp band in IR spectrum.
- An isolated C=C bond stretching does not change the dipole moment. Hence this shows a very weak signal in IR.
Number of Vibrational Modes:
- For non-linear molecules, number of types of vibrations: 3N-6
- For linear molecules, number of types of vibrations: 3N-5
Transmission Vs. Absorption
When a chemical sample is exposed to the action of IR LIGHT, it can absorb some frequencies and transmit the rest. Some of the light can also be reflected back to the source.
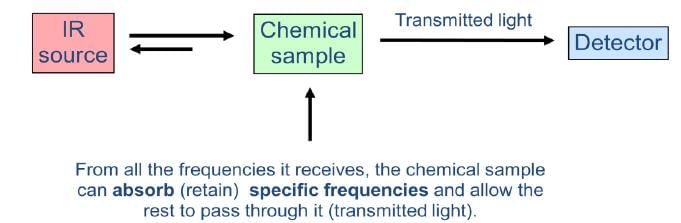
The detector detects the transmitted frequencies, and by doing so also reveals the values of the absorbed frequencies.
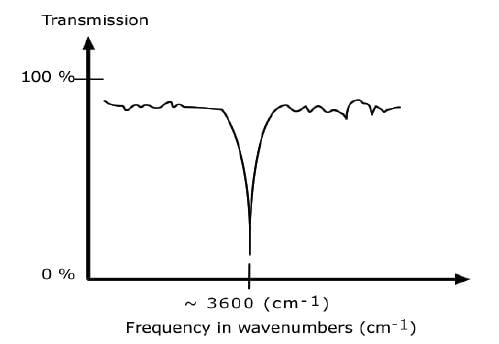
AN IR SPECTRUM IN TRANSMISSION MODE
The IR spectrum is basically a plot of transmitted (or absorbed) frequencies vs. intensity of the transmission (or absorption). Frequencies appear in the x-axis in units of inverse centimeters (wavenumbers), and intensities are plotted on the y-axis in percentage units.
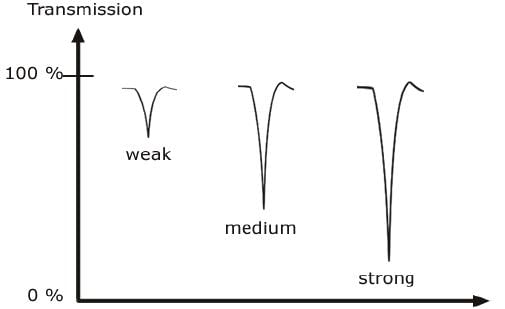
CLASSIFICATION OF IR BANDS
IR bands can be classified as strong (s), medium (m), or weak (w), depending on their relative intensities in the infrared spectrum. A strong band covers most of the y-axis. A medium band falls to about half of the y-axis, and a weak band falls to about one third or less of the y-axis.
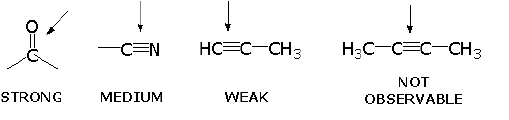
INFRARED ACTIVE BONDS
- Vibration at same frequency as in light.
- But also, must have a change in its net dipole moment as a result of the vibration. The intensity of the bands depends on the magnitude of the dipole moment associated with the bond in question:
- Strongly polar bonds such as carbonyl groups (C=O) produce strong bands.
- Medium polarity bonds and asymmetric bonds produce medium bands.
- Weakly polar bond and symmetric bonds produce weak or non observable bands.
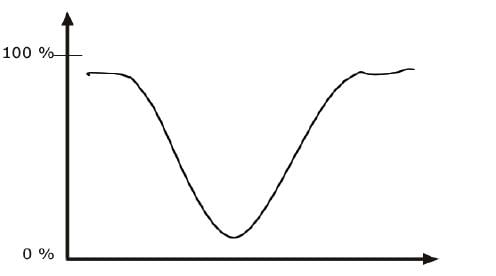
INFRARED BAND SHAPES
Infrared band shapes come in various forms. Two of the most common are narrow and broad. Narrow bands are thin and pointed, like a dagger. Broad bands are wide and smoother.
A typical example of a broad band is that displayed by O-H bonds, such as those found in alcohols and carboxylic acids, as shown below.
INFORMATION OBTAINED FROM IR SPECTRA
- IR is most useful in providing information about the presence or absence of specific functional groups.
- IR can provide a molecular fingerprint that can be used when comparing samples. If two pure samples display the same IR spectrum it can be argued that they are the same compound.
- IR does not provide detailed information or proof of molecular formula or structure. It provides information on molecular fragments, specifically functional groups.
- Therefore it is very limited in scope, and must be used in conjunction with other techniques to provide a more complete picture of the molecular structure.
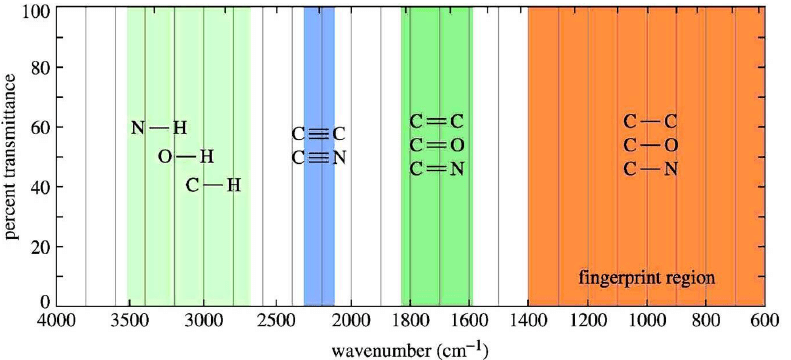
IR ABSORPTION RANGE
The typical IR absorption range for covalent bonds is 600-4000 cm–1. The graph shows the regions of the spectrum where the following types of bonds normally absorb. For example, a sharp band around 2200-2400 cm–1 would indicate the possible presence of a C-N or a C-C triple bond.
1. Alkanes-of C—C and C—H bonds
- C—C stretches and bends 1360-1470 cm–1
- CH2—CH2 bond 1450-1470 cm–1
- CH2—CH3 bond 1360-1390 cm–1
- sp3 C—H between 2800-3000 cm–1
2. Alkenes – addition of the C=C and vinyl C—H bonds
- C=C stretch at 1620-1680 cm–1 weaker as substitution increases
- vinyl C—H stretch occurs at 3000-3100 cm–1
- The difference between alkane, alkene or alkyne C—H is important! If the band is slightly above 3000 it is vinyl sp2 C—H or alkynyl sp C—H if it is below it is alkyl sp3 C—H
3. Alkynes – addition of the C=C and vinyl C—H bonds
- C≡C stretch 2100-2260 cm–1; strength depends on asymmetry of bond, strongest for terminal alkynes, weakest for symmetrical internal alkynes
- C—H for terminal alkynes occurs at 3200-3300 cm–1
- Internal alkynes ( R—C≡C—R ) would not have this band!
3. Aromatics
- Due to the delocalization of e– in the ring, C—C bond order is 1.5, the stretching frequency for these bonds is slightly lower in energy than normal C=C
- These show up as a pair of sharp bands, 1500 & 1600 cm–1, (lower frequency band is stronger)
- C-H bonds off the ring show up similar to vinyl C—H at 3000-3100 cm–1
- If the region between 1667-2000 cm–1 (w) is free of interference (C=O stretching frequency is in this region) a weak grouping of peaks is observed for aromatic systems
- Analysis of this region, called the overtone of bending region, can lead to a determination of the substitution pattern on the aromatic ring
4. Unsaturated Systems – substitution patterns
- The substitution of aromatics and alkenes can also be discerned through the out-of-plane bending vibration region
- However, other peaks often are apparent in this region. These peaks should only be used for reinforcement of what is known or for hypothesizing as to the functional pattern.
5. Ethers – addition of the C—O—C asymmetric band and vinyl C—H bonds
- Show a strong band for the antisymmetric C—O—C stretch at 1050-1150 cm–1
- Otherwise, dominated by the hydrocarbon component of the rest of the molecule
6. Alcohols
- Strong, broad O—H stretch from 3200-3400 cm–1
- Like ethers, C—O stretch from 1050-1260 cm–1
- Band position changes depending on the alcohols substitution: 1° 1075-1000; 2° 1075-1150; 3° 1100-1200; phenol 1180-1260
- The shape is due to the presence of hydrogen bonding
7. Amines - Primary
- Shows the —N—H stretch for NH2 as a doublet between 3200-3500 cm–1 (symmetric and anti-symmetric modes)
- —NH2 has deformation band from 1590-1650 cm–1
- Additionally there is a “wag” band at 780-820 cm–1 that is not diagnostic
8. Amines – Secondary
- N—H band for R2N—H occurs at 3200-3500 cm–1 as a single sharp peak weaker than —O—H
- Tertiary amines (R3N) have no N-H bond and will not have a band in this region
9. Aldehydes
- C=O (carbonyl) stretch from 1720-1740 cm–1
- Band is sensitive to conjugation, as are all carbonyls (upcoming slide)
- A highly unique sp2 C—H stretch appears as a doublet, 2720 & 2820 cm–1 called a “Fermi doublet”
10. Ketones
- Simplest of the carbonyl compounds as far as IR spectrum – carbonyl only
- C=O stretch occurs at 1705-1725 cm–1
11. Esters
- C=O stretch at 1735-1750 cm–1
- Strong band for C—O at a higher frequency than ethers or alcohols at 1150-1250 cm–1
12. Carboxylic Acids:
- Gives the messiest of IR spectra
- C=O band occurs between 1700-1725 cm–1
- The highly dissociated O—H bond has a broad band from 2400-3500 cm–1 covering up to half the IR spectrum in some cases
13. Acid anhydrides
- Coupling of the anhydride though the ether oxygen splits the carbonyl band into two with a separation of 70 cm–1
- Bands are at 1740-1770 cm–1 and 1810-1840 cm–1
- Mixed mode C—O stretch at 1000-1100 cm–1
14. Acid halides
- Clefted band at 1770-1820 cm–1 for C=O
- Bonds to halogens, due to their size (see Hooke’s Law derivation) occur at low frequencies, only Cl is light enough to have a band on IR, C—Cl is at 600-800 cm–1
15. Amides
- Display features of amines and carbonyl compounds
- C=O stretch at 1640-1680 cm–1
- If the amide is primary (—NH2) the N—H stretch occurs from 3200-3500 cm–1 as a doublet
- If the amide is secondary (—NHR) the N—H stretch occurs at 3200-3500 cm–1 as a sharp singlet
16. Nitro group (—NO2)
- Proper Lewis structure gives a bond order of 1.5 from nitrogen to each oxygen
- Two bands are seen (symmetric and asymmetric) at 1300-1380 cm–1 and 1500-1570 cm–1
- This group is a strong resonance withdrawing group and is itself vulnerable to resonance effects
17. Nitriles (the cyano- or –C≡N group)
- Principle group is the carbon nitrogen triple bond at 2100-2280 cm–1
- This peak is usually much more intense than that of the alkyne due to the electronegativity difference between carbon and nitrogen.
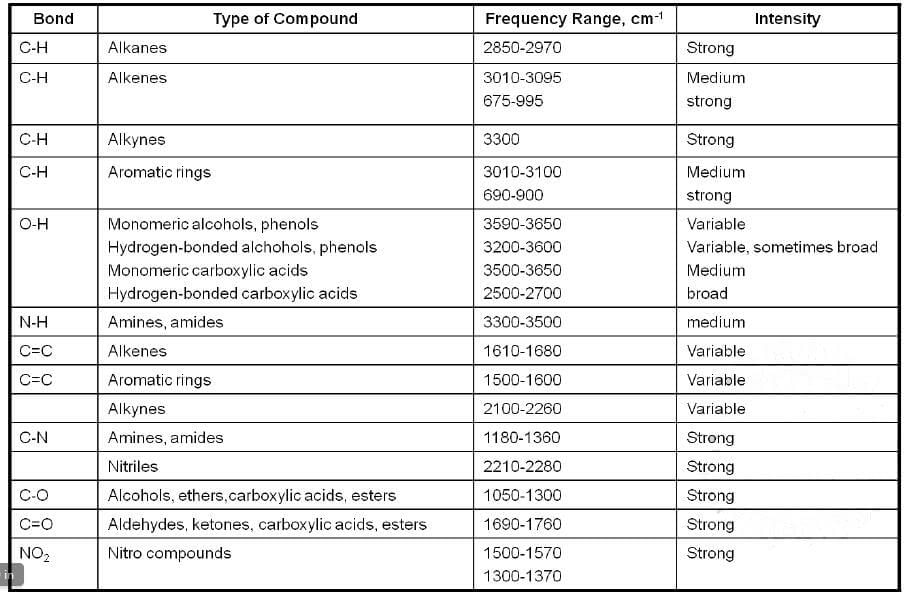
Table1. A summary of the principle infrared bands and their assignments.(R is an aliphatic group)
|
44 videos|102 docs|52 tests
|
FAQs on Theory of IR Absorption - IR Spectroscopy - Organic Chemistry
| 1. What is the theory behind IR absorption in IR spectroscopy? |  |
| 2. How does IR absorption help in identifying molecular structures? | |
| 3. What factors affect the intensity of IR absorption bands? | |
| 4. How can IR spectroscopy be used in quantitative analysis? | |
| 5. What are the advantages of using IR spectroscopy over other spectroscopic techniques? | |


past year papers
,Semester Notes
,video lectures
,Previous Year Questions with Solutions
,shortcuts and tricks
,study material
,practice quizzes
,MCQs
,Theory of IR Absorption - IR Spectroscopy | Organic Chemistry
,Extra Questions
,Important questions
,ppt
,Summary
,Sample Paper
,Theory of IR Absorption - IR Spectroscopy | Organic Chemistry
,Objective type Questions
,Theory of IR Absorption - IR Spectroscopy | Organic Chemistry
,Free
,mock tests for examination
,Viva Questions
,Exam
;


Theory of IR Absorption - IR Spectroscopy Free PDF Download
Importance of Theory of IR Absorption - IR Spectroscopy
Theory of IR Absorption - IR Spectroscopy Notes
Theory of IR Absorption - IR Spectroscopy Chemistry Questions
Study Theory of IR Absorption - IR Spectroscopy on the App
|
© EduRev
|
Education Revolution
|


|


within 7 days!